Immigrants from Northern Europe vs Puerto Rican Median Earnings
COMPARE
Immigrants from Northern Europe
Puerto Rican
Median Earnings
Median Earnings Comparison
Immigrants from Northern Europe
Puerto Ricans
$53,872
MEDIAN EARNINGS
100.0/ 100
METRIC RATING
26th/ 347
METRIC RANK
$35,560
MEDIAN EARNINGS
0.0/ 100
METRIC RATING
347th/ 347
METRIC RANK
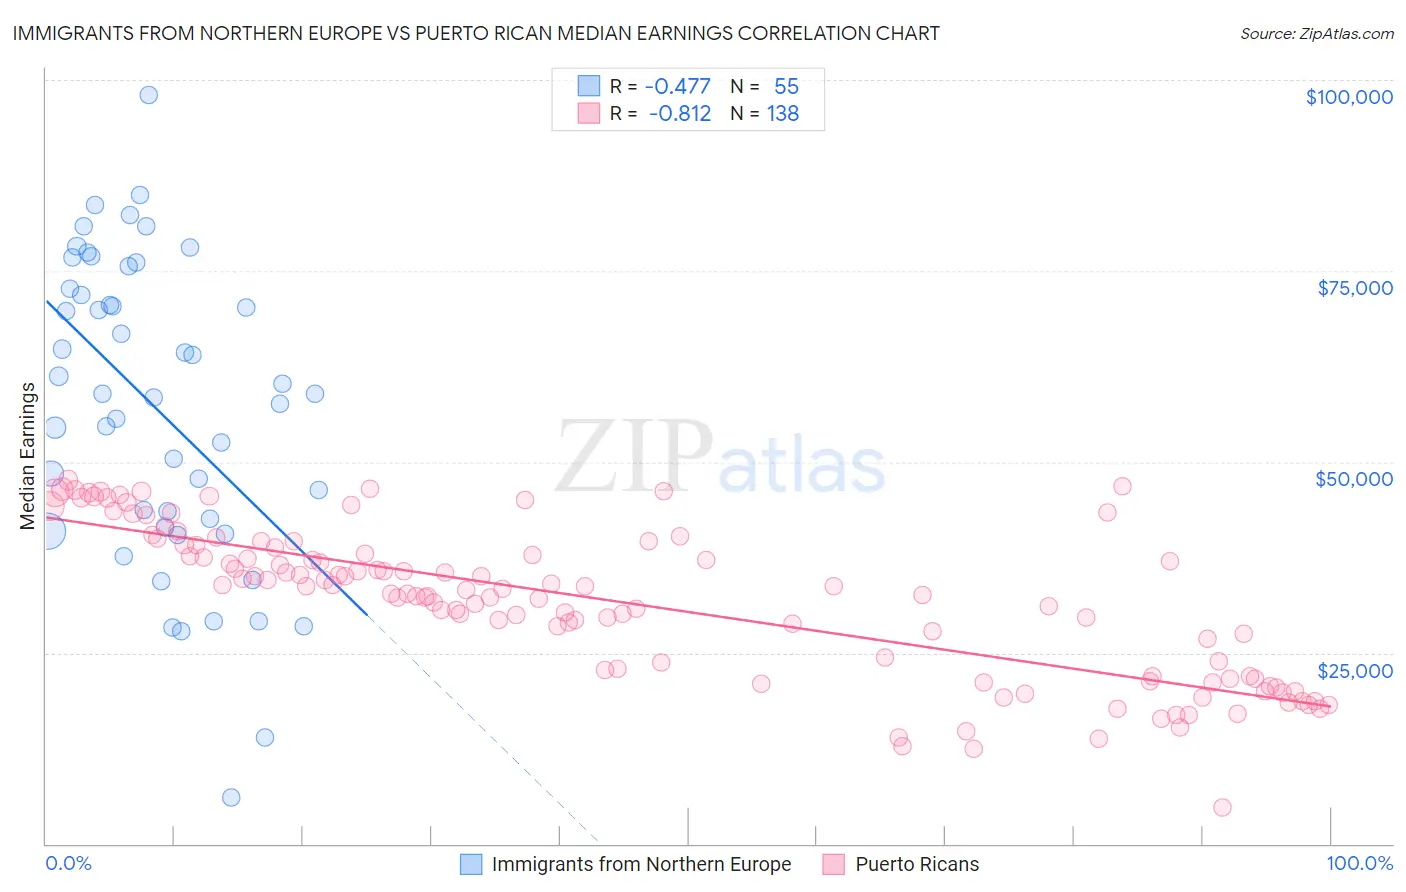
Immigrants from Northern Europe vs Puerto Rican Median Earnings Correlation Chart
The statistical analysis conducted on geographies consisting of 477,145,093 people shows a moderate negative correlation between the proportion of Immigrants from Northern Europe and median earnings in the United States with a correlation coefficient (R) of -0.477 and weighted average of $53,872. Similarly, the statistical analysis conducted on geographies consisting of 528,218,544 people shows a very strong negative correlation between the proportion of Puerto Ricans and median earnings in the United States with a correlation coefficient (R) of -0.812 and weighted average of $35,560, a difference of 51.5%.
Median Earnings Correlation Summary
| Measurement | Immigrants from Northern Europe | Puerto Rican |
| Minimum | $5,997 | $4,737 |
| Maximum | $98,000 | $47,601 |
| Range | $92,003 | $42,864 |
| Mean | $56,961 | $31,795 |
| Median | $58,943 | $33,297 |
| Interquartile 25% (IQ1) | $41,349 | $22,818 |
| Interquartile 75% (IQ3) | $72,683 | $39,100 |
| Interquartile Range (IQR) | $31,335 | $16,282 |
| Standard Deviation (Sample) | $19,840 | $9,771 |
| Standard Deviation (Population) | $19,659 | $9,736 |
Similar Demographics by Median Earnings
Demographics Similar to Immigrants from Northern Europe by Median Earnings
In terms of median earnings, the demographic groups most similar to Immigrants from Northern Europe are Turkish ($53,919, a difference of 0.090%), Asian ($53,690, a difference of 0.34%), Immigrants from France ($53,490, a difference of 0.71%), Soviet Union ($54,290, a difference of 0.78%), and Immigrants from Russia ($53,457, a difference of 0.78%).
| Demographics | Rating | Rank | Median Earnings |
| Immigrants | Belgium | 100.0 /100 | #19 | Exceptional $54,679 |
| Cypriots | 100.0 /100 | #20 | Exceptional $54,589 |
| Burmese | 100.0 /100 | #21 | Exceptional $54,559 |
| Immigrants | Korea | 100.0 /100 | #22 | Exceptional $54,530 |
| Immigrants | Sweden | 100.0 /100 | #23 | Exceptional $54,478 |
| Soviet Union | 100.0 /100 | #24 | Exceptional $54,290 |
| Turks | 100.0 /100 | #25 | Exceptional $53,919 |
| Immigrants | Northern Europe | 100.0 /100 | #26 | Exceptional $53,872 |
| Asians | 100.0 /100 | #27 | Exceptional $53,690 |
| Immigrants | France | 100.0 /100 | #28 | Exceptional $53,490 |
| Immigrants | Russia | 100.0 /100 | #29 | Exceptional $53,457 |
| Cambodians | 100.0 /100 | #30 | Exceptional $53,386 |
| Russians | 100.0 /100 | #31 | Exceptional $53,334 |
| Immigrants | Asia | 100.0 /100 | #32 | Exceptional $53,310 |
| Immigrants | Greece | 100.0 /100 | #33 | Exceptional $53,282 |
Demographics Similar to Puerto Ricans by Median Earnings
In terms of median earnings, the demographic groups most similar to Puerto Ricans are Yup'ik ($35,942, a difference of 1.1%), Tohono O'odham ($36,349, a difference of 2.2%), Arapaho ($36,586, a difference of 2.9%), Pueblo ($36,859, a difference of 3.6%), and Hopi ($36,871, a difference of 3.7%).
| Demographics | Rating | Rank | Median Earnings |
| Houma | 0.0 /100 | #333 | Tragic $38,949 |
| Spanish American Indians | 0.0 /100 | #334 | Tragic $38,907 |
| Natives/Alaskans | 0.0 /100 | #335 | Tragic $38,896 |
| Crow | 0.0 /100 | #336 | Tragic $38,707 |
| Immigrants | Cuba | 0.0 /100 | #337 | Tragic $38,426 |
| Pima | 0.0 /100 | #338 | Tragic $38,285 |
| Menominee | 0.0 /100 | #339 | Tragic $37,884 |
| Navajo | 0.0 /100 | #340 | Tragic $36,999 |
| Lumbee | 0.0 /100 | #341 | Tragic $36,876 |
| Hopi | 0.0 /100 | #342 | Tragic $36,871 |
| Pueblo | 0.0 /100 | #343 | Tragic $36,859 |
| Arapaho | 0.0 /100 | #344 | Tragic $36,586 |
| Tohono O'odham | 0.0 /100 | #345 | Tragic $36,349 |
| Yup'ik | 0.0 /100 | #346 | Tragic $35,942 |
| Puerto Ricans | 0.0 /100 | #347 | Tragic $35,560 |