Immigrants from Lebanon vs Kenyan Median Earnings
COMPARE
Immigrants from Lebanon
Kenyan
Median Earnings
Median Earnings Comparison
Immigrants from Lebanon
Kenyans
$49,682
MEDIAN EARNINGS
99.0/ 100
METRIC RATING
96th/ 347
METRIC RANK
$46,462
MEDIAN EARNINGS
51.0/ 100
METRIC RATING
172nd/ 347
METRIC RANK
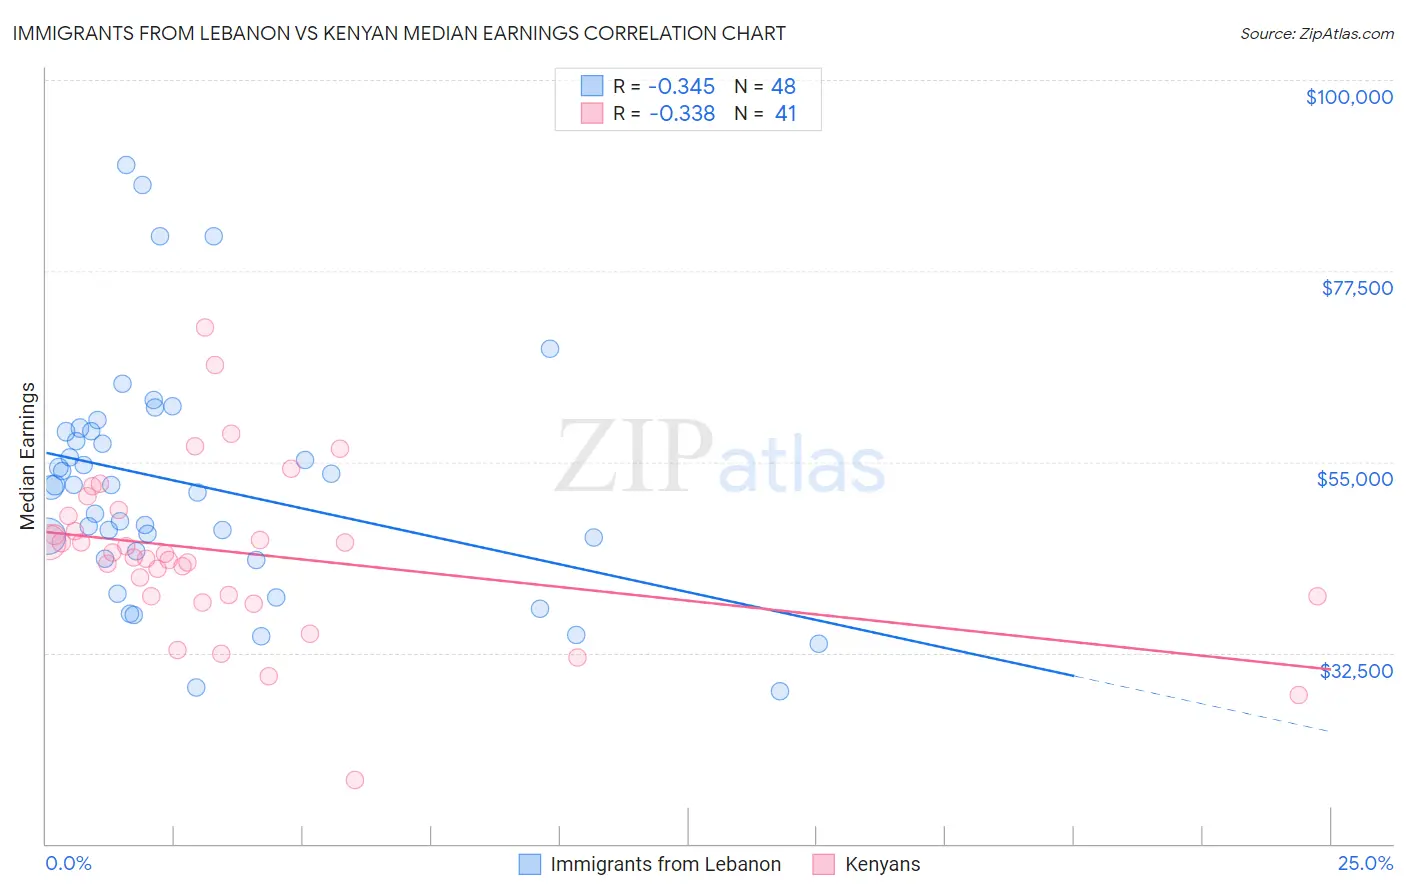
Immigrants from Lebanon vs Kenyan Median Earnings Correlation Chart
The statistical analysis conducted on geographies consisting of 217,150,005 people shows a mild negative correlation between the proportion of Immigrants from Lebanon and median earnings in the United States with a correlation coefficient (R) of -0.345 and weighted average of $49,682. Similarly, the statistical analysis conducted on geographies consisting of 168,231,616 people shows a mild negative correlation between the proportion of Kenyans and median earnings in the United States with a correlation coefficient (R) of -0.338 and weighted average of $46,462, a difference of 6.9%.
Median Earnings Correlation Summary
| Measurement | Immigrants from Lebanon | Kenyan |
| Minimum | $27,932 | $17,500 |
| Maximum | $89,953 | $70,848 |
| Range | $62,021 | $53,348 |
| Mean | $52,128 | $44,292 |
| Median | $52,076 | $44,246 |
| Interquartile 25% (IQ1) | $44,033 | $39,165 |
| Interquartile 75% (IQ3) | $58,565 | $49,031 |
| Interquartile Range (IQR) | $14,532 | $9,866 |
| Standard Deviation (Sample) | $13,798 | $9,917 |
| Standard Deviation (Population) | $13,653 | $9,795 |
Similar Demographics by Median Earnings
Demographics Similar to Immigrants from Lebanon by Median Earnings
In terms of median earnings, the demographic groups most similar to Immigrants from Lebanon are Immigrants from North Macedonia ($49,658, a difference of 0.050%), Immigrants from Northern Africa ($49,648, a difference of 0.070%), Immigrants from Afghanistan ($49,645, a difference of 0.070%), Immigrants from England ($49,722, a difference of 0.080%), and Croatian ($49,724, a difference of 0.090%).
| Demographics | Rating | Rank | Median Earnings |
| Immigrants | North America | 99.4 /100 | #89 | Exceptional $50,108 |
| Italians | 99.3 /100 | #90 | Exceptional $49,915 |
| Macedonians | 99.2 /100 | #91 | Exceptional $49,893 |
| Immigrants | Argentina | 99.2 /100 | #92 | Exceptional $49,841 |
| Armenians | 99.1 /100 | #93 | Exceptional $49,804 |
| Croatians | 99.0 /100 | #94 | Exceptional $49,724 |
| Immigrants | England | 99.0 /100 | #95 | Exceptional $49,722 |
| Immigrants | Lebanon | 99.0 /100 | #96 | Exceptional $49,682 |
| Immigrants | North Macedonia | 98.9 /100 | #97 | Exceptional $49,658 |
| Immigrants | Northern Africa | 98.9 /100 | #98 | Exceptional $49,648 |
| Immigrants | Afghanistan | 98.9 /100 | #99 | Exceptional $49,645 |
| Immigrants | Poland | 98.9 /100 | #100 | Exceptional $49,633 |
| Jordanians | 98.9 /100 | #101 | Exceptional $49,632 |
| Ethiopians | 98.8 /100 | #102 | Exceptional $49,572 |
| Austrians | 98.7 /100 | #103 | Exceptional $49,501 |
Demographics Similar to Kenyans by Median Earnings
In terms of median earnings, the demographic groups most similar to Kenyans are Scottish ($46,463, a difference of 0.0%), Immigrants ($46,478, a difference of 0.030%), Ghanaian ($46,440, a difference of 0.050%), Scandinavian ($46,433, a difference of 0.060%), and Basque ($46,399, a difference of 0.14%).
| Demographics | Rating | Rank | Median Earnings |
| South Americans | 62.7 /100 | #165 | Good $46,804 |
| Czechoslovakians | 57.8 /100 | #166 | Average $46,658 |
| Costa Ricans | 57.4 /100 | #167 | Average $46,645 |
| Immigrants | Africa | 54.6 /100 | #168 | Average $46,564 |
| Immigrants | South America | 54.0 /100 | #169 | Average $46,548 |
| Immigrants | Immigrants | 51.6 /100 | #170 | Average $46,478 |
| Scottish | 51.1 /100 | #171 | Average $46,463 |
| Kenyans | 51.0 /100 | #172 | Average $46,462 |
| Ghanaians | 50.3 /100 | #173 | Average $46,440 |
| Scandinavians | 50.0 /100 | #174 | Average $46,433 |
| Basques | 48.8 /100 | #175 | Average $46,399 |
| Danes | 48.6 /100 | #176 | Average $46,392 |
| Belgians | 48.0 /100 | #177 | Average $46,375 |
| Colombians | 47.1 /100 | #178 | Average $46,349 |
| English | 46.5 /100 | #179 | Average $46,334 |