French Canadian vs Kenyan Median Earnings
COMPARE
French Canadian
Kenyan
Median Earnings
Median Earnings Comparison
French Canadians
Kenyans
$46,026
MEDIAN EARNINGS
36.1/ 100
METRIC RATING
190th/ 347
METRIC RANK
$46,462
MEDIAN EARNINGS
51.0/ 100
METRIC RATING
172nd/ 347
METRIC RANK
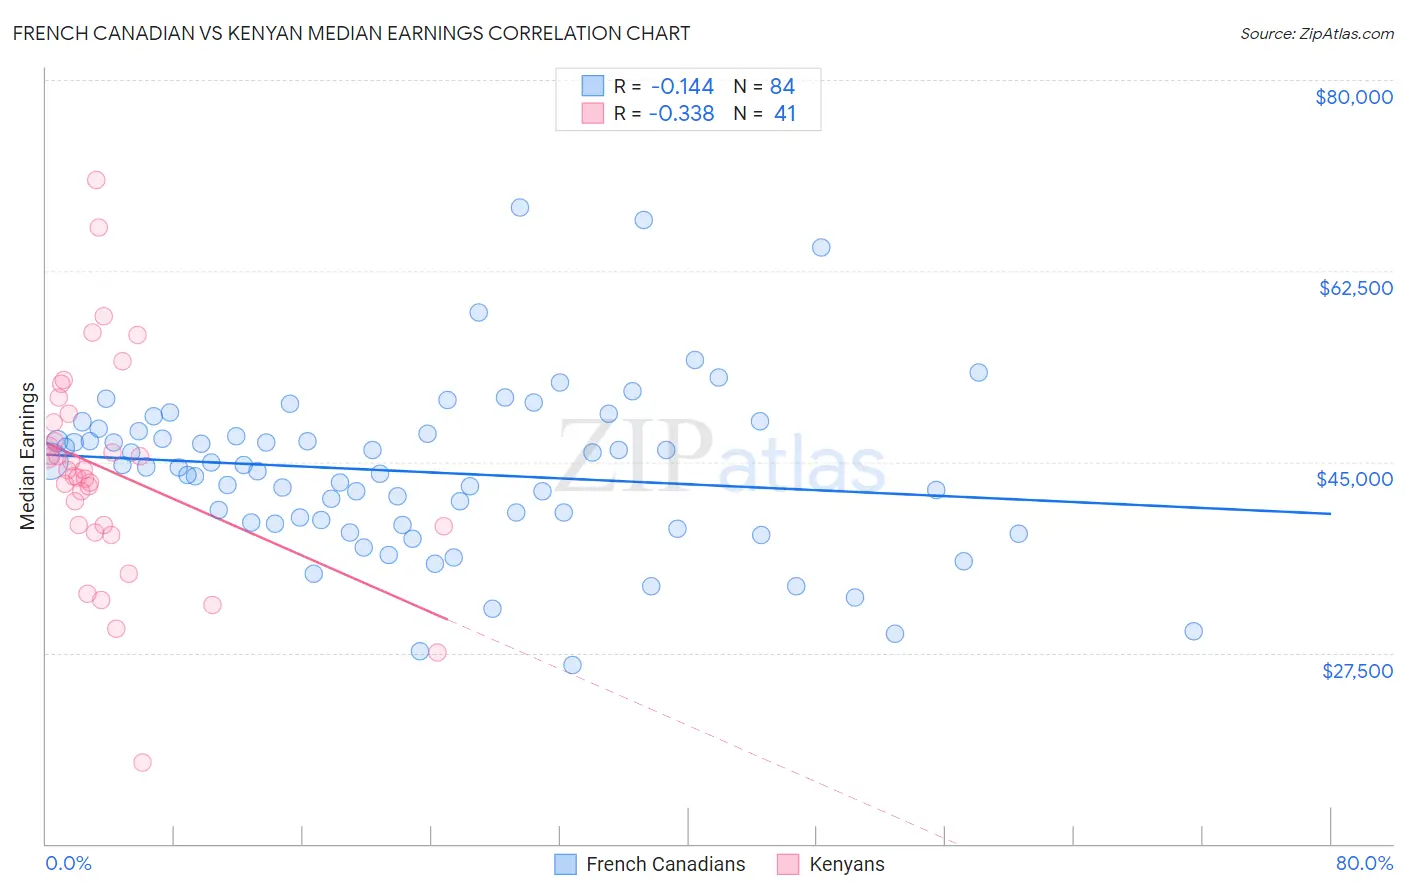
French Canadian vs Kenyan Median Earnings Correlation Chart
The statistical analysis conducted on geographies consisting of 502,564,111 people shows a poor negative correlation between the proportion of French Canadians and median earnings in the United States with a correlation coefficient (R) of -0.144 and weighted average of $46,026. Similarly, the statistical analysis conducted on geographies consisting of 168,231,616 people shows a mild negative correlation between the proportion of Kenyans and median earnings in the United States with a correlation coefficient (R) of -0.338 and weighted average of $46,462, a difference of 0.95%.
Median Earnings Correlation Summary
| Measurement | French Canadian | Kenyan |
| Minimum | $26,346 | $17,500 |
| Maximum | $68,284 | $70,848 |
| Range | $41,938 | $53,348 |
| Mean | $44,063 | $44,292 |
| Median | $44,489 | $44,246 |
| Interquartile 25% (IQ1) | $39,382 | $39,165 |
| Interquartile 75% (IQ3) | $47,671 | $49,031 |
| Interquartile Range (IQR) | $8,289 | $9,866 |
| Standard Deviation (Sample) | $7,666 | $9,917 |
| Standard Deviation (Population) | $7,620 | $9,795 |
Demographics Similar to French Canadians and Kenyans by Median Earnings
In terms of median earnings, the demographic groups most similar to French Canadians are Spaniard ($46,059, a difference of 0.070%), Immigrants from Armenia ($46,094, a difference of 0.15%), Finnish ($45,940, a difference of 0.19%), Iraqi ($46,140, a difference of 0.25%), and Vietnamese ($46,172, a difference of 0.32%). Similarly, the demographic groups most similar to Kenyans are Scottish ($46,463, a difference of 0.0%), Ghanaian ($46,440, a difference of 0.050%), Scandinavian ($46,433, a difference of 0.060%), Basque ($46,399, a difference of 0.14%), and Danish ($46,392, a difference of 0.15%).
| Demographics | Rating | Rank | Median Earnings |
| Scottish | 51.1 /100 | #171 | Average $46,463 |
| Kenyans | 51.0 /100 | #172 | Average $46,462 |
| Ghanaians | 50.3 /100 | #173 | Average $46,440 |
| Scandinavians | 50.0 /100 | #174 | Average $46,433 |
| Basques | 48.8 /100 | #175 | Average $46,399 |
| Danes | 48.6 /100 | #176 | Average $46,392 |
| Belgians | 48.0 /100 | #177 | Average $46,375 |
| Colombians | 47.1 /100 | #178 | Average $46,349 |
| English | 46.5 /100 | #179 | Average $46,334 |
| Puget Sound Salish | 46.5 /100 | #180 | Average $46,333 |
| Immigrants | Cameroon | 46.4 /100 | #181 | Average $46,329 |
| Swiss | 45.9 /100 | #182 | Average $46,315 |
| French | 45.2 /100 | #183 | Average $46,296 |
| Immigrants | Kenya | 42.4 /100 | #184 | Average $46,214 |
| Uruguayans | 41.6 /100 | #185 | Average $46,190 |
| Vietnamese | 40.9 /100 | #186 | Average $46,172 |
| Iraqis | 39.9 /100 | #187 | Fair $46,140 |
| Immigrants | Armenia | 38.3 /100 | #188 | Fair $46,094 |
| Spaniards | 37.2 /100 | #189 | Fair $46,059 |
| French Canadians | 36.1 /100 | #190 | Fair $46,026 |
| Finns | 33.4 /100 | #191 | Fair $45,940 |