Immigrants from Poland vs Navajo Median Earnings
COMPARE
Immigrants from Poland
Navajo
Median Earnings
Median Earnings Comparison
Immigrants from Poland
Navajo
$49,633
MEDIAN EARNINGS
98.9/ 100
METRIC RATING
100th/ 347
METRIC RANK
$36,999
MEDIAN EARNINGS
0.0/ 100
METRIC RATING
340th/ 347
METRIC RANK
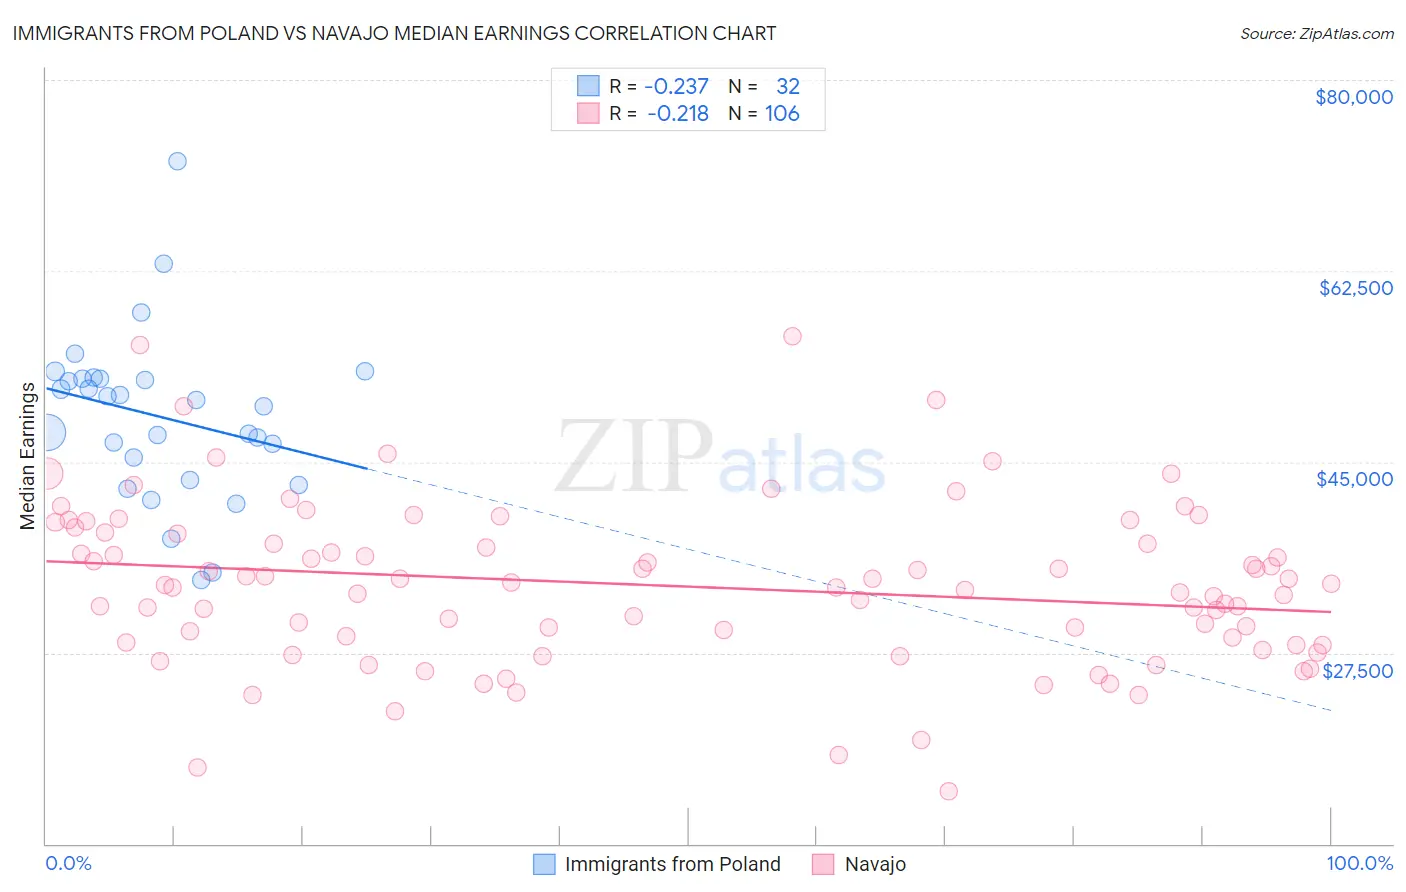
Immigrants from Poland vs Navajo Median Earnings Correlation Chart
The statistical analysis conducted on geographies consisting of 304,849,071 people shows a weak negative correlation between the proportion of Immigrants from Poland and median earnings in the United States with a correlation coefficient (R) of -0.237 and weighted average of $49,633. Similarly, the statistical analysis conducted on geographies consisting of 224,830,448 people shows a weak negative correlation between the proportion of Navajo and median earnings in the United States with a correlation coefficient (R) of -0.218 and weighted average of $36,999, a difference of 34.2%.
Median Earnings Correlation Summary
| Measurement | Immigrants from Poland | Navajo |
| Minimum | $34,220 | $14,775 |
| Maximum | $72,500 | $56,536 |
| Range | $38,280 | $41,761 |
| Mean | $49,130 | $33,645 |
| Median | $50,398 | $33,604 |
| Interquartile 25% (IQ1) | $44,359 | $28,471 |
| Interquartile 75% (IQ3) | $52,592 | $38,362 |
| Interquartile Range (IQR) | $8,233 | $9,890 |
| Standard Deviation (Sample) | $7,639 | $7,461 |
| Standard Deviation (Population) | $7,518 | $7,426 |
Similar Demographics by Median Earnings
Demographics Similar to Immigrants from Poland by Median Earnings
In terms of median earnings, the demographic groups most similar to Immigrants from Poland are Jordanian ($49,632, a difference of 0.0%), Immigrants from Afghanistan ($49,645, a difference of 0.020%), Immigrants from Northern Africa ($49,648, a difference of 0.030%), Immigrants from North Macedonia ($49,658, a difference of 0.050%), and Immigrants from Lebanon ($49,682, a difference of 0.10%).
| Demographics | Rating | Rank | Median Earnings |
| Armenians | 99.1 /100 | #93 | Exceptional $49,804 |
| Croatians | 99.0 /100 | #94 | Exceptional $49,724 |
| Immigrants | England | 99.0 /100 | #95 | Exceptional $49,722 |
| Immigrants | Lebanon | 99.0 /100 | #96 | Exceptional $49,682 |
| Immigrants | North Macedonia | 98.9 /100 | #97 | Exceptional $49,658 |
| Immigrants | Northern Africa | 98.9 /100 | #98 | Exceptional $49,648 |
| Immigrants | Afghanistan | 98.9 /100 | #99 | Exceptional $49,645 |
| Immigrants | Poland | 98.9 /100 | #100 | Exceptional $49,633 |
| Jordanians | 98.9 /100 | #101 | Exceptional $49,632 |
| Ethiopians | 98.8 /100 | #102 | Exceptional $49,572 |
| Austrians | 98.7 /100 | #103 | Exceptional $49,501 |
| Immigrants | Brazil | 98.6 /100 | #104 | Exceptional $49,463 |
| Immigrants | Western Asia | 98.4 /100 | #105 | Exceptional $49,389 |
| Immigrants | Albania | 98.4 /100 | #106 | Exceptional $49,377 |
| Immigrants | Morocco | 98.4 /100 | #107 | Exceptional $49,368 |
Demographics Similar to Navajo by Median Earnings
In terms of median earnings, the demographic groups most similar to Navajo are Lumbee ($36,876, a difference of 0.33%), Hopi ($36,871, a difference of 0.35%), Pueblo ($36,859, a difference of 0.38%), Arapaho ($36,586, a difference of 1.1%), and Tohono O'odham ($36,349, a difference of 1.8%).
| Demographics | Rating | Rank | Median Earnings |
| Houma | 0.0 /100 | #333 | Tragic $38,949 |
| Spanish American Indians | 0.0 /100 | #334 | Tragic $38,907 |
| Natives/Alaskans | 0.0 /100 | #335 | Tragic $38,896 |
| Crow | 0.0 /100 | #336 | Tragic $38,707 |
| Immigrants | Cuba | 0.0 /100 | #337 | Tragic $38,426 |
| Pima | 0.0 /100 | #338 | Tragic $38,285 |
| Menominee | 0.0 /100 | #339 | Tragic $37,884 |
| Navajo | 0.0 /100 | #340 | Tragic $36,999 |
| Lumbee | 0.0 /100 | #341 | Tragic $36,876 |
| Hopi | 0.0 /100 | #342 | Tragic $36,871 |
| Pueblo | 0.0 /100 | #343 | Tragic $36,859 |
| Arapaho | 0.0 /100 | #344 | Tragic $36,586 |
| Tohono O'odham | 0.0 /100 | #345 | Tragic $36,349 |
| Yup'ik | 0.0 /100 | #346 | Tragic $35,942 |
| Puerto Ricans | 0.0 /100 | #347 | Tragic $35,560 |