Immigrants from Taiwan vs Indian (Asian) Median Earnings
COMPARE
Immigrants from Taiwan
Indian (Asian)
Median Earnings
Median Earnings Comparison
Immigrants from Taiwan
Indians (Asian)
$61,151
MEDIAN EARNINGS
100.0/ 100
METRIC RATING
2nd/ 347
METRIC RANK
$56,253
MEDIAN EARNINGS
100.0/ 100
METRIC RATING
15th/ 347
METRIC RANK
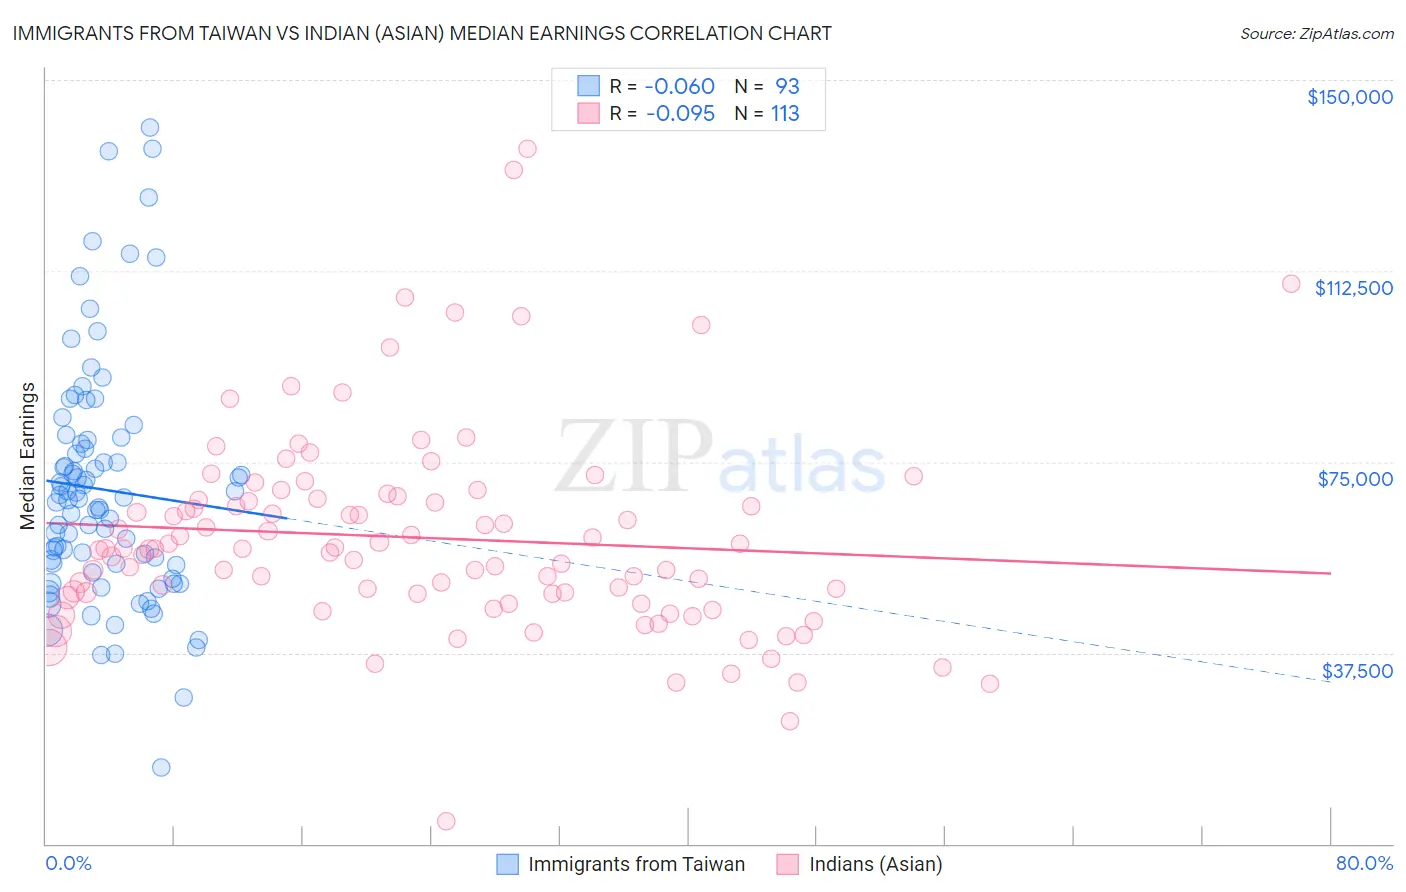
Immigrants from Taiwan vs Indian (Asian) Median Earnings Correlation Chart
The statistical analysis conducted on geographies consisting of 298,281,567 people shows a slight negative correlation between the proportion of Immigrants from Taiwan and median earnings in the United States with a correlation coefficient (R) of -0.060 and weighted average of $61,151. Similarly, the statistical analysis conducted on geographies consisting of 495,313,309 people shows a slight negative correlation between the proportion of Indians (Asian) and median earnings in the United States with a correlation coefficient (R) of -0.095 and weighted average of $56,253, a difference of 8.7%.
Median Earnings Correlation Summary
| Measurement | Immigrants from Taiwan | Indian (Asian) |
| Minimum | $15,000 | $4,382 |
| Maximum | $140,742 | $136,388 |
| Range | $125,742 | $132,006 |
| Mean | $69,540 | $60,085 |
| Median | $67,496 | $57,869 |
| Interquartile 25% (IQ1) | $54,032 | $48,728 |
| Interquartile 75% (IQ3) | $78,915 | $67,622 |
| Interquartile Range (IQR) | $24,883 | $18,894 |
| Standard Deviation (Sample) | $23,624 | $20,110 |
| Standard Deviation (Population) | $23,497 | $20,020 |
Demographics Similar to Immigrants from Taiwan and Indians (Asian) by Median Earnings
In terms of median earnings, the demographic groups most similar to Immigrants from Taiwan are Filipino ($61,197, a difference of 0.080%), Immigrants from India ($60,648, a difference of 0.83%), Immigrants from Hong Kong ($59,433, a difference of 2.9%), Thai ($59,237, a difference of 3.2%), and Immigrants from Singapore ($59,038, a difference of 3.6%). Similarly, the demographic groups most similar to Indians (Asian) are Immigrants from Australia ($56,305, a difference of 0.090%), Immigrants from Eastern Asia ($56,183, a difference of 0.12%), Immigrants from China ($56,638, a difference of 0.68%), Immigrants from Ireland ($56,854, a difference of 1.1%), and Immigrants from Israel ($57,034, a difference of 1.4%).
| Demographics | Rating | Rank | Median Earnings |
| Filipinos | 100.0 /100 | #1 | Exceptional $61,197 |
| Immigrants | Taiwan | 100.0 /100 | #2 | Exceptional $61,151 |
| Immigrants | India | 100.0 /100 | #3 | Exceptional $60,648 |
| Immigrants | Hong Kong | 100.0 /100 | #4 | Exceptional $59,433 |
| Thais | 100.0 /100 | #5 | Exceptional $59,237 |
| Immigrants | Singapore | 100.0 /100 | #6 | Exceptional $59,038 |
| Iranians | 100.0 /100 | #7 | Exceptional $58,474 |
| Immigrants | Iran | 100.0 /100 | #8 | Exceptional $57,612 |
| Okinawans | 100.0 /100 | #9 | Exceptional $57,550 |
| Immigrants | South Central Asia | 100.0 /100 | #10 | Exceptional $57,114 |
| Immigrants | Israel | 100.0 /100 | #11 | Exceptional $57,034 |
| Immigrants | Ireland | 100.0 /100 | #12 | Exceptional $56,854 |
| Immigrants | China | 100.0 /100 | #13 | Exceptional $56,638 |
| Immigrants | Australia | 100.0 /100 | #14 | Exceptional $56,305 |
| Indians (Asian) | 100.0 /100 | #15 | Exceptional $56,253 |
| Immigrants | Eastern Asia | 100.0 /100 | #16 | Exceptional $56,183 |
| Eastern Europeans | 100.0 /100 | #17 | Exceptional $55,084 |
| Immigrants | Japan | 100.0 /100 | #18 | Exceptional $54,938 |
| Immigrants | Belgium | 100.0 /100 | #19 | Exceptional $54,679 |
| Cypriots | 100.0 /100 | #20 | Exceptional $54,589 |