Immigrants from Laos vs Indian (Asian) Cognitive Disability
COMPARE
Immigrants from Laos
Indian (Asian)
Cognitive Disability
Cognitive Disability Comparison
Immigrants from Laos
Indians (Asian)
18.1%
COGNITIVE DISABILITY
0.2/ 100
METRIC RATING
275th/ 347
METRIC RANK
16.8%
COGNITIVE DISABILITY
97.2/ 100
METRIC RATING
112th/ 347
METRIC RANK
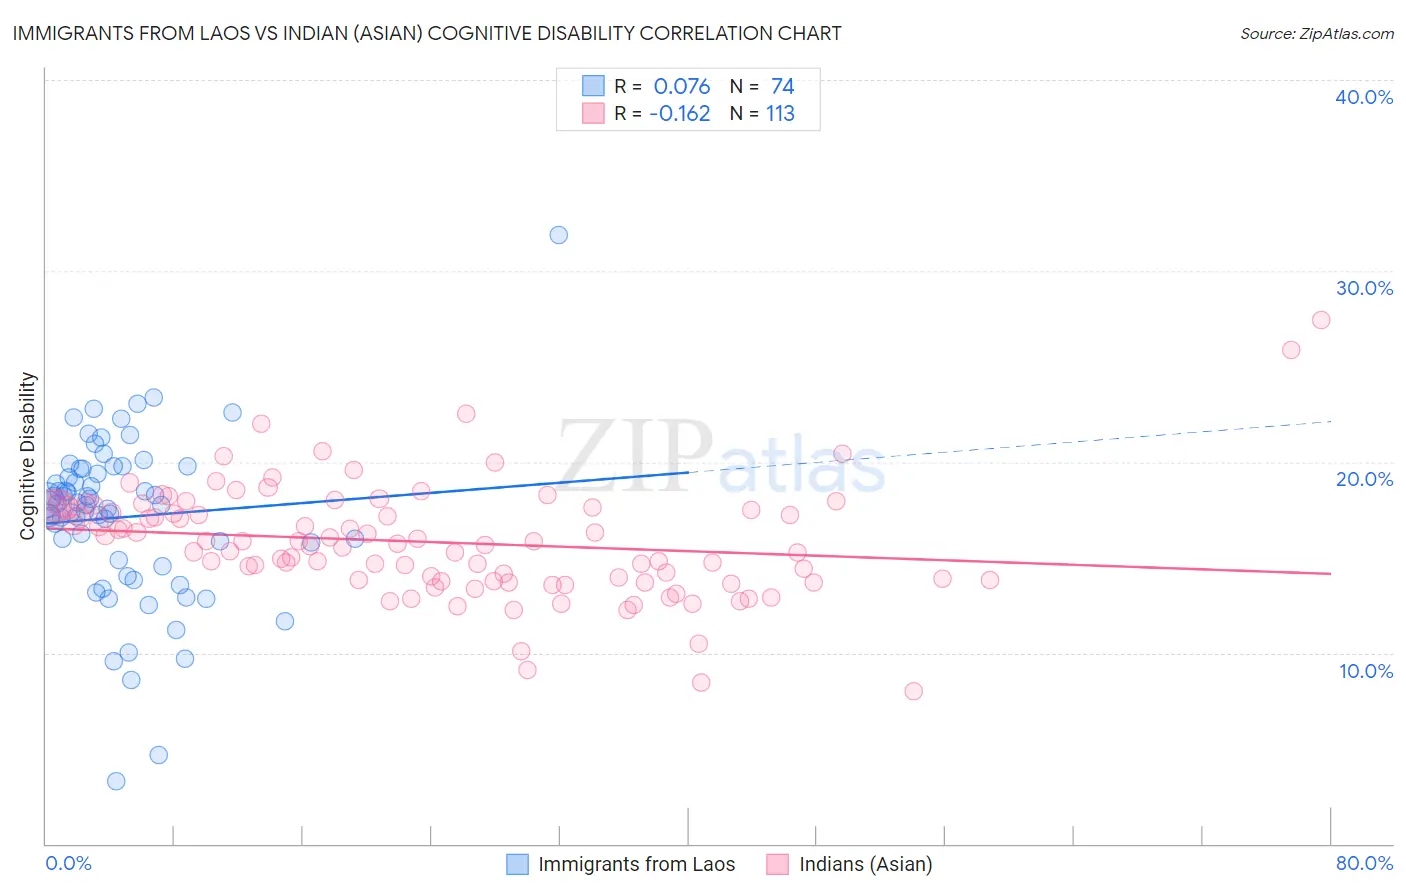
Immigrants from Laos vs Indian (Asian) Cognitive Disability Correlation Chart
The statistical analysis conducted on geographies consisting of 201,469,201 people shows a slight positive correlation between the proportion of Immigrants from Laos and percentage of population with cognitive disability in the United States with a correlation coefficient (R) of 0.076 and weighted average of 18.1%. Similarly, the statistical analysis conducted on geographies consisting of 495,263,567 people shows a poor negative correlation between the proportion of Indians (Asian) and percentage of population with cognitive disability in the United States with a correlation coefficient (R) of -0.162 and weighted average of 16.8%, a difference of 7.2%.
Cognitive Disability Correlation Summary
| Measurement | Immigrants from Laos | Indian (Asian) |
| Minimum | 3.3% | 8.0% |
| Maximum | 31.9% | 27.5% |
| Range | 28.6% | 19.5% |
| Mean | 17.1% | 15.8% |
| Median | 17.8% | 15.7% |
| Interquartile 25% (IQ1) | 14.9% | 13.8% |
| Interquartile 75% (IQ3) | 19.6% | 17.6% |
| Interquartile Range (IQR) | 4.7% | 3.8% |
| Standard Deviation (Sample) | 4.3% | 3.0% |
| Standard Deviation (Population) | 4.3% | 3.0% |
Similar Demographics by Cognitive Disability
Demographics Similar to Immigrants from Laos by Cognitive Disability
In terms of cognitive disability, the demographic groups most similar to Immigrants from Laos are Yuman (18.1%, a difference of 0.040%), Immigrants from Kuwait (18.1%, a difference of 0.050%), Immigrants from Micronesia (18.1%, a difference of 0.050%), Immigrants from Nigeria (18.0%, a difference of 0.10%), and Chippewa (18.1%, a difference of 0.10%).
| Demographics | Rating | Rank | Cognitive Disability |
| Cherokee | 0.3 /100 | #268 | Tragic 18.0% |
| Hondurans | 0.3 /100 | #269 | Tragic 18.0% |
| Immigrants | Bahamas | 0.3 /100 | #270 | Tragic 18.0% |
| Potawatomi | 0.2 /100 | #271 | Tragic 18.0% |
| Immigrants | Honduras | 0.2 /100 | #272 | Tragic 18.0% |
| Immigrants | Nepal | 0.2 /100 | #273 | Tragic 18.0% |
| Immigrants | Nigeria | 0.2 /100 | #274 | Tragic 18.0% |
| Immigrants | Laos | 0.2 /100 | #275 | Tragic 18.1% |
| Yuman | 0.2 /100 | #276 | Tragic 18.1% |
| Immigrants | Kuwait | 0.2 /100 | #277 | Tragic 18.1% |
| Immigrants | Micronesia | 0.2 /100 | #278 | Tragic 18.1% |
| Chippewa | 0.1 /100 | #279 | Tragic 18.1% |
| West Indians | 0.1 /100 | #280 | Tragic 18.1% |
| Yakama | 0.1 /100 | #281 | Tragic 18.1% |
| Immigrants | Cambodia | 0.1 /100 | #282 | Tragic 18.1% |
Demographics Similar to Indians (Asian) by Cognitive Disability
In terms of cognitive disability, the demographic groups most similar to Indians (Asian) are Immigrants from Sri Lanka (16.8%, a difference of 0.0%), Korean (16.8%, a difference of 0.010%), Uruguayan (16.8%, a difference of 0.020%), Albanian (16.8%, a difference of 0.040%), and Arapaho (16.8%, a difference of 0.040%).
| Demographics | Rating | Rank | Cognitive Disability |
| Immigrants | Eastern Asia | 97.9 /100 | #105 | Exceptional 16.8% |
| Northern Europeans | 97.8 /100 | #106 | Exceptional 16.8% |
| Immigrants | Nicaragua | 97.8 /100 | #107 | Exceptional 16.8% |
| Canadians | 97.5 /100 | #108 | Exceptional 16.8% |
| Albanians | 97.3 /100 | #109 | Exceptional 16.8% |
| Arapaho | 97.3 /100 | #110 | Exceptional 16.8% |
| Uruguayans | 97.2 /100 | #111 | Exceptional 16.8% |
| Indians (Asian) | 97.2 /100 | #112 | Exceptional 16.8% |
| Immigrants | Sri Lanka | 97.1 /100 | #113 | Exceptional 16.8% |
| Koreans | 97.1 /100 | #114 | Exceptional 16.8% |
| Yup'ik | 96.9 /100 | #115 | Exceptional 16.9% |
| Inupiat | 96.5 /100 | #116 | Exceptional 16.9% |
| Immigrants | Japan | 96.2 /100 | #117 | Exceptional 16.9% |
| Immigrants | Denmark | 96.2 /100 | #118 | Exceptional 16.9% |
| South Africans | 95.5 /100 | #119 | Exceptional 16.9% |