Immigrants from Korea vs Immigrants from Yemen Bachelor's Degree
COMPARE
Immigrants from Korea
Immigrants from Yemen
Bachelor's Degree
Bachelor's Degree Comparison
Immigrants from Korea
Immigrants from Yemen
47.0%
BACHELOR'S DEGREE
100.0/ 100
METRIC RATING
24th/ 347
METRIC RANK
29.9%
BACHELOR'S DEGREE
0.0/ 100
METRIC RATING
306th/ 347
METRIC RANK
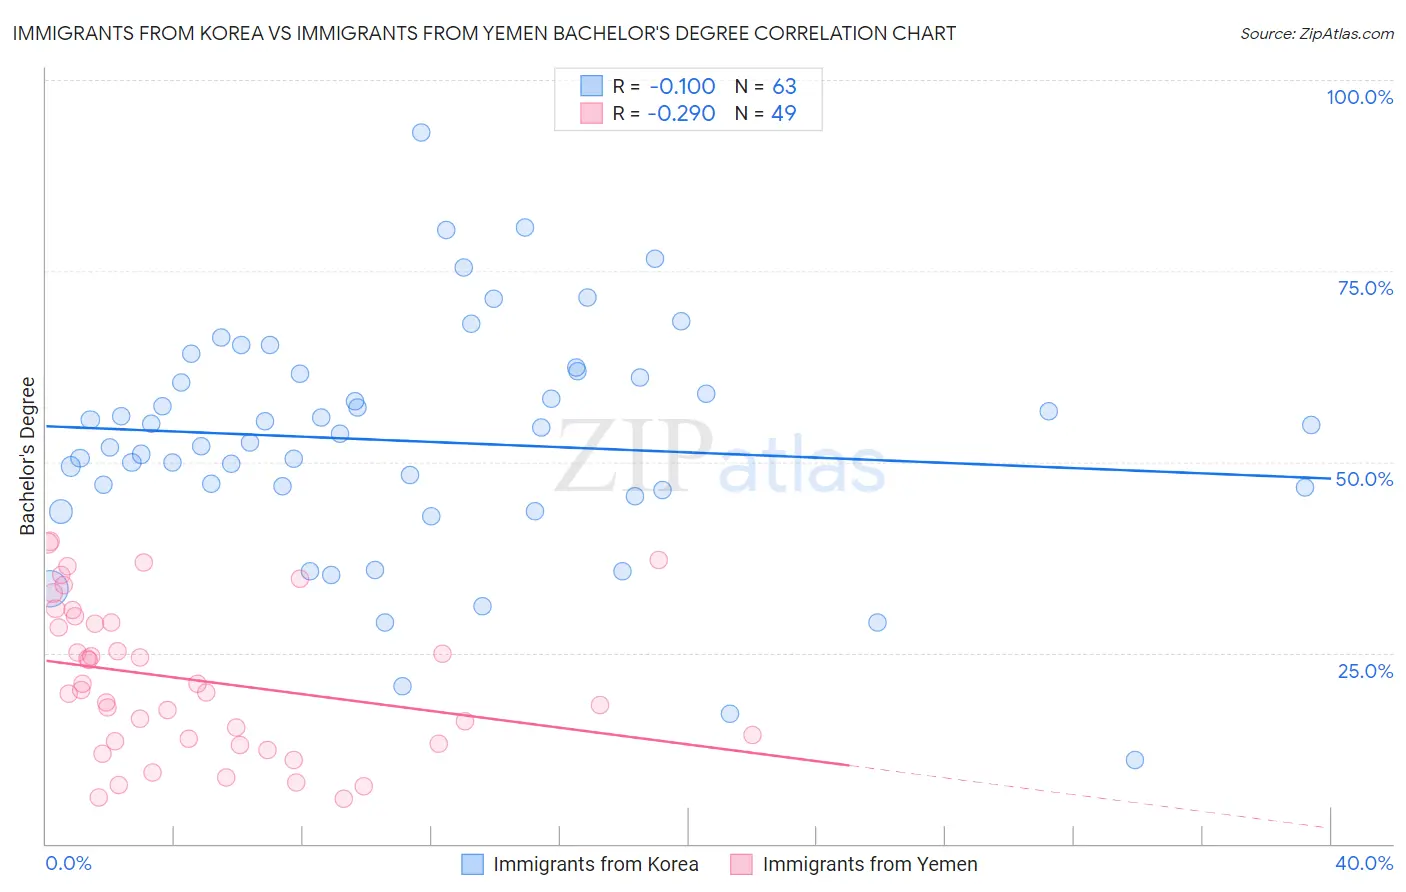
Immigrants from Korea vs Immigrants from Yemen Bachelor's Degree Correlation Chart
The statistical analysis conducted on geographies consisting of 416,289,272 people shows a slight negative correlation between the proportion of Immigrants from Korea and percentage of population with at least bachelor's degree education in the United States with a correlation coefficient (R) of -0.100 and weighted average of 47.0%. Similarly, the statistical analysis conducted on geographies consisting of 82,429,885 people shows a weak negative correlation between the proportion of Immigrants from Yemen and percentage of population with at least bachelor's degree education in the United States with a correlation coefficient (R) of -0.290 and weighted average of 29.9%, a difference of 57.1%.
Bachelor's Degree Correlation Summary
| Measurement | Immigrants from Korea | Immigrants from Yemen |
| Minimum | 10.9% | 5.8% |
| Maximum | 93.1% | 39.6% |
| Range | 82.2% | 33.8% |
| Mean | 52.7% | 21.5% |
| Median | 53.7% | 20.1% |
| Interquartile 25% (IQ1) | 46.3% | 13.3% |
| Interquartile 75% (IQ3) | 61.5% | 29.4% |
| Interquartile Range (IQR) | 15.2% | 16.1% |
| Standard Deviation (Sample) | 15.3% | 9.8% |
| Standard Deviation (Population) | 15.1% | 9.7% |
Similar Demographics by Bachelor's Degree
Demographics Similar to Immigrants from Korea by Bachelor's Degree
In terms of bachelor's degree, the demographic groups most similar to Immigrants from Korea are Immigrants from Sweden (47.0%, a difference of 0.040%), Immigrants from Belgium (47.0%, a difference of 0.13%), Burmese (46.9%, a difference of 0.22%), Immigrants from Ireland (47.1%, a difference of 0.33%), and Immigrants from Japan (46.8%, a difference of 0.33%).
| Demographics | Rating | Rank | Bachelor's Degree |
| Eastern Europeans | 100.0 /100 | #17 | Exceptional 47.5% |
| Indians (Asian) | 100.0 /100 | #18 | Exceptional 47.4% |
| Cambodians | 100.0 /100 | #19 | Exceptional 47.2% |
| Immigrants | Switzerland | 100.0 /100 | #20 | Exceptional 47.1% |
| Immigrants | Ireland | 100.0 /100 | #21 | Exceptional 47.1% |
| Immigrants | Belgium | 100.0 /100 | #22 | Exceptional 47.0% |
| Immigrants | Sweden | 100.0 /100 | #23 | Exceptional 47.0% |
| Immigrants | Korea | 100.0 /100 | #24 | Exceptional 47.0% |
| Burmese | 100.0 /100 | #25 | Exceptional 46.9% |
| Immigrants | Japan | 100.0 /100 | #26 | Exceptional 46.8% |
| Immigrants | France | 100.0 /100 | #27 | Exceptional 46.4% |
| Turks | 100.0 /100 | #28 | Exceptional 46.2% |
| Israelis | 100.0 /100 | #29 | Exceptional 46.1% |
| Immigrants | Sri Lanka | 100.0 /100 | #30 | Exceptional 46.1% |
| Latvians | 100.0 /100 | #31 | Exceptional 46.1% |
Demographics Similar to Immigrants from Yemen by Bachelor's Degree
In terms of bachelor's degree, the demographic groups most similar to Immigrants from Yemen are Nepalese (29.9%, a difference of 0.040%), Immigrants from Latin America (30.1%, a difference of 0.55%), Cajun (29.6%, a difference of 0.89%), Cherokee (30.2%, a difference of 0.97%), and Bangladeshi (30.2%, a difference of 0.98%).
| Demographics | Rating | Rank | Bachelor's Degree |
| Chickasaw | 0.0 /100 | #299 | Tragic 30.4% |
| Immigrants | Micronesia | 0.0 /100 | #300 | Tragic 30.4% |
| Immigrants | Cuba | 0.0 /100 | #301 | Tragic 30.3% |
| Mexican American Indians | 0.0 /100 | #302 | Tragic 30.2% |
| Bangladeshis | 0.0 /100 | #303 | Tragic 30.2% |
| Cherokee | 0.0 /100 | #304 | Tragic 30.2% |
| Immigrants | Latin America | 0.0 /100 | #305 | Tragic 30.1% |
| Immigrants | Yemen | 0.0 /100 | #306 | Tragic 29.9% |
| Nepalese | 0.0 /100 | #307 | Tragic 29.9% |
| Cajuns | 0.0 /100 | #308 | Tragic 29.6% |
| Hispanics or Latinos | 0.0 /100 | #309 | Tragic 29.6% |
| Cheyenne | 0.0 /100 | #310 | Tragic 29.4% |
| Choctaw | 0.0 /100 | #311 | Tragic 29.4% |
| Seminole | 0.0 /100 | #312 | Tragic 29.4% |
| Alaska Natives | 0.0 /100 | #313 | Tragic 29.4% |