Immigrants from Iraq vs Immigrants from Western Europe Median Household Income
COMPARE
Immigrants from Iraq
Immigrants from Western Europe
Median Household Income
Median Household Income Comparison
Immigrants from Iraq
Immigrants from Western Europe
$82,594
MEDIAN HOUSEHOLD INCOME
16.7/ 100
METRIC RATING
209th/ 347
METRIC RANK
$91,936
MEDIAN HOUSEHOLD INCOME
98.8/ 100
METRIC RATING
92nd/ 347
METRIC RANK
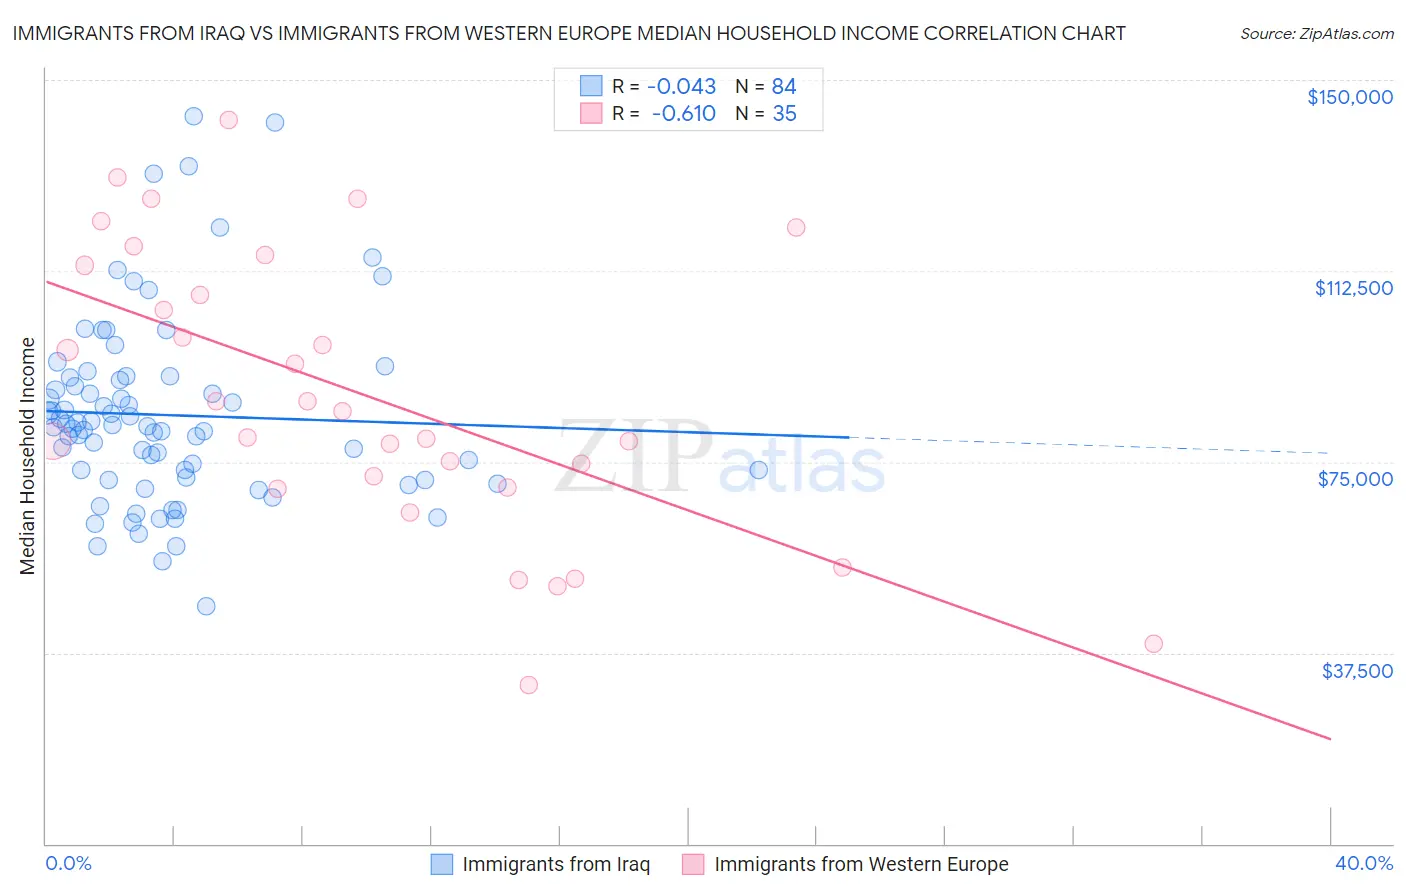
Immigrants from Iraq vs Immigrants from Western Europe Median Household Income Correlation Chart
The statistical analysis conducted on geographies consisting of 194,736,423 people shows no correlation between the proportion of Immigrants from Iraq and median household income in the United States with a correlation coefficient (R) of -0.043 and weighted average of $82,594. Similarly, the statistical analysis conducted on geographies consisting of 493,674,241 people shows a significant negative correlation between the proportion of Immigrants from Western Europe and median household income in the United States with a correlation coefficient (R) of -0.610 and weighted average of $91,936, a difference of 11.3%.
Median Household Income Correlation Summary
| Measurement | Immigrants from Iraq | Immigrants from Western Europe |
| Minimum | $46,565 | $31,182 |
| Maximum | $142,768 | $142,061 |
| Range | $96,203 | $110,879 |
| Mean | $84,180 | $87,927 |
| Median | $81,932 | $84,863 |
| Interquartile 25% (IQ1) | $71,691 | $69,977 |
| Interquartile 75% (IQ3) | $91,376 | $113,640 |
| Interquartile Range (IQR) | $19,685 | $43,663 |
| Standard Deviation (Sample) | $18,542 | $27,795 |
| Standard Deviation (Population) | $18,431 | $27,395 |
Similar Demographics by Median Household Income
Demographics Similar to Immigrants from Iraq by Median Household Income
In terms of median household income, the demographic groups most similar to Immigrants from Iraq are Immigrants from Uruguay ($82,560, a difference of 0.040%), Salvadoran ($82,449, a difference of 0.18%), Venezuelan ($82,432, a difference of 0.20%), Nepalese ($82,410, a difference of 0.22%), and French Canadian ($82,810, a difference of 0.26%).
| Demographics | Rating | Rank | Median Household Income |
| Immigrants | Thailand | 24.3 /100 | #202 | Fair $83,327 |
| Immigrants | Cambodia | 24.0 /100 | #203 | Fair $83,304 |
| Immigrants | Africa | 23.8 /100 | #204 | Fair $83,289 |
| Celtics | 22.7 /100 | #205 | Fair $83,193 |
| Immigrants | Kenya | 21.3 /100 | #206 | Fair $83,068 |
| Dutch | 20.3 /100 | #207 | Fair $82,971 |
| French Canadians | 18.7 /100 | #208 | Poor $82,810 |
| Immigrants | Iraq | 16.7 /100 | #209 | Poor $82,594 |
| Immigrants | Uruguay | 16.4 /100 | #210 | Poor $82,560 |
| Salvadorans | 15.4 /100 | #211 | Poor $82,449 |
| Venezuelans | 15.3 /100 | #212 | Poor $82,432 |
| Nepalese | 15.1 /100 | #213 | Poor $82,410 |
| Panamanians | 14.0 /100 | #214 | Poor $82,272 |
| Vietnamese | 13.8 /100 | #215 | Poor $82,248 |
| Yugoslavians | 13.3 /100 | #216 | Poor $82,186 |
Demographics Similar to Immigrants from Western Europe by Median Household Income
In terms of median household income, the demographic groups most similar to Immigrants from Western Europe are Immigrants from Lebanon ($91,887, a difference of 0.050%), Romanian ($91,994, a difference of 0.060%), Assyrian/Chaldean/Syriac ($91,991, a difference of 0.060%), Immigrants from Vietnam ($91,987, a difference of 0.060%), and Immigrants from North America ($91,860, a difference of 0.080%).
| Demographics | Rating | Rank | Median Household Income |
| Immigrants | Croatia | 99.0 /100 | #85 | Exceptional $92,225 |
| Immigrants | England | 98.9 /100 | #86 | Exceptional $92,098 |
| Immigrants | Hungary | 98.9 /100 | #87 | Exceptional $92,094 |
| Immigrants | Canada | 98.8 /100 | #88 | Exceptional $92,029 |
| Romanians | 98.8 /100 | #89 | Exceptional $91,994 |
| Assyrians/Chaldeans/Syriacs | 98.8 /100 | #90 | Exceptional $91,991 |
| Immigrants | Vietnam | 98.8 /100 | #91 | Exceptional $91,987 |
| Immigrants | Western Europe | 98.8 /100 | #92 | Exceptional $91,936 |
| Immigrants | Lebanon | 98.7 /100 | #93 | Exceptional $91,887 |
| Immigrants | North America | 98.7 /100 | #94 | Exceptional $91,860 |
| Armenians | 98.7 /100 | #95 | Exceptional $91,807 |
| Jordanians | 98.7 /100 | #96 | Exceptional $91,794 |
| Immigrants | Serbia | 98.6 /100 | #97 | Exceptional $91,730 |
| Immigrants | Southern Europe | 98.5 /100 | #98 | Exceptional $91,605 |
| Immigrants | South Eastern Asia | 98.4 /100 | #99 | Exceptional $91,541 |