Immigrants from Iraq vs Arapaho Median Household Income
COMPARE
Immigrants from Iraq
Arapaho
Median Household Income
Median Household Income Comparison
Immigrants from Iraq
Arapaho
$82,594
MEDIAN HOUSEHOLD INCOME
16.7/ 100
METRIC RATING
209th/ 347
METRIC RANK
$67,965
MEDIAN HOUSEHOLD INCOME
0.0/ 100
METRIC RATING
330th/ 347
METRIC RANK
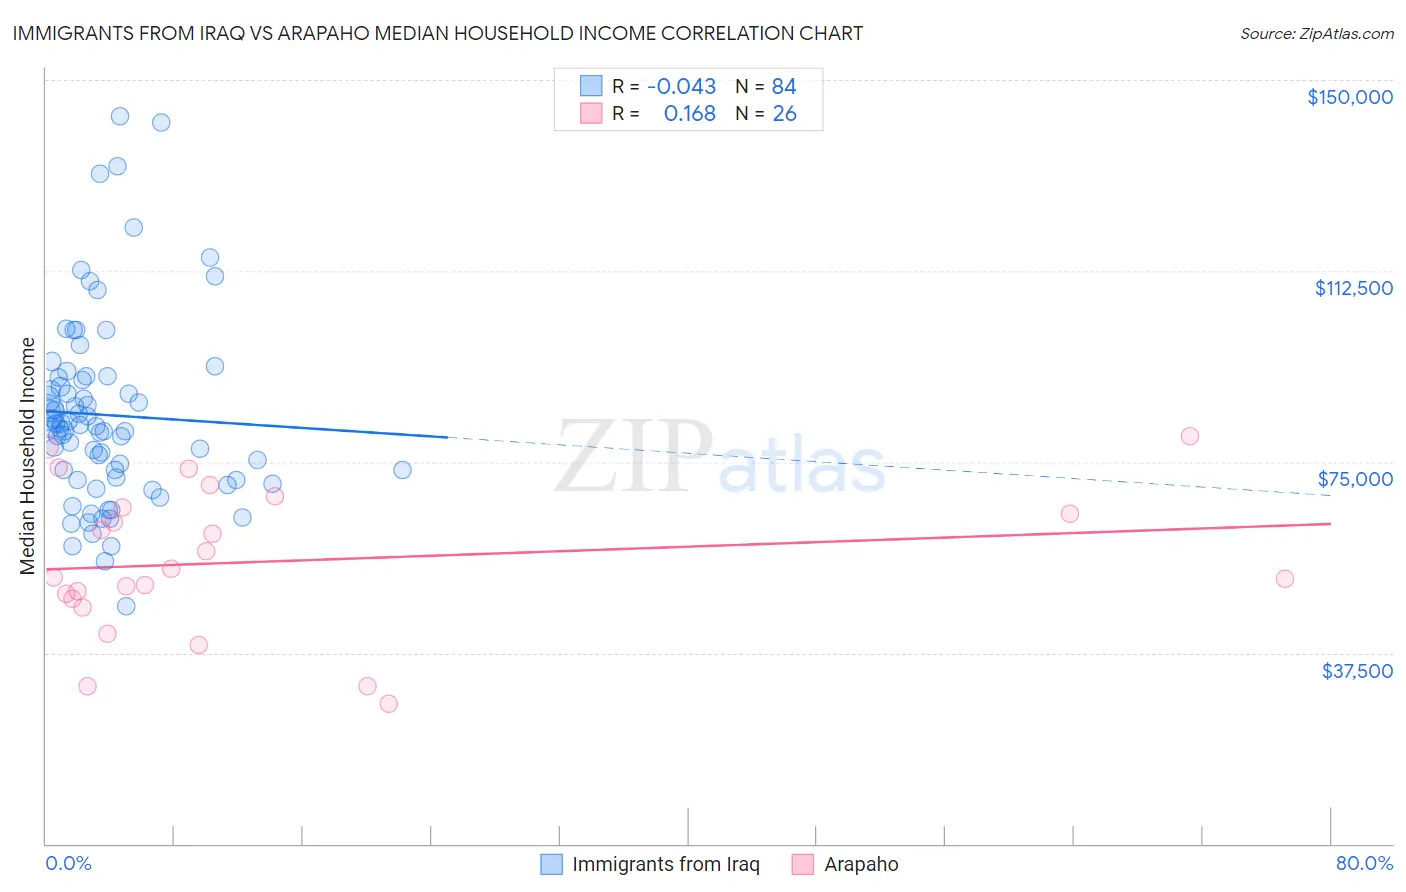
Immigrants from Iraq vs Arapaho Median Household Income Correlation Chart
The statistical analysis conducted on geographies consisting of 194,736,423 people shows no correlation between the proportion of Immigrants from Iraq and median household income in the United States with a correlation coefficient (R) of -0.043 and weighted average of $82,594. Similarly, the statistical analysis conducted on geographies consisting of 29,777,139 people shows a poor positive correlation between the proportion of Arapaho and median household income in the United States with a correlation coefficient (R) of 0.168 and weighted average of $67,965, a difference of 21.5%.
Median Household Income Correlation Summary
| Measurement | Immigrants from Iraq | Arapaho |
| Minimum | $46,565 | $27,500 |
| Maximum | $142,768 | $80,000 |
| Range | $96,203 | $52,500 |
| Mean | $84,180 | $55,430 |
| Median | $81,932 | $53,182 |
| Interquartile 25% (IQ1) | $71,691 | $47,998 |
| Interquartile 75% (IQ3) | $91,376 | $66,111 |
| Interquartile Range (IQR) | $19,685 | $18,113 |
| Standard Deviation (Sample) | $18,542 | $14,479 |
| Standard Deviation (Population) | $18,431 | $14,198 |
Similar Demographics by Median Household Income
Demographics Similar to Immigrants from Iraq by Median Household Income
In terms of median household income, the demographic groups most similar to Immigrants from Iraq are Immigrants from Uruguay ($82,560, a difference of 0.040%), Salvadoran ($82,449, a difference of 0.18%), Venezuelan ($82,432, a difference of 0.20%), Nepalese ($82,410, a difference of 0.22%), and French Canadian ($82,810, a difference of 0.26%).
| Demographics | Rating | Rank | Median Household Income |
| Immigrants | Thailand | 24.3 /100 | #202 | Fair $83,327 |
| Immigrants | Cambodia | 24.0 /100 | #203 | Fair $83,304 |
| Immigrants | Africa | 23.8 /100 | #204 | Fair $83,289 |
| Celtics | 22.7 /100 | #205 | Fair $83,193 |
| Immigrants | Kenya | 21.3 /100 | #206 | Fair $83,068 |
| Dutch | 20.3 /100 | #207 | Fair $82,971 |
| French Canadians | 18.7 /100 | #208 | Poor $82,810 |
| Immigrants | Iraq | 16.7 /100 | #209 | Poor $82,594 |
| Immigrants | Uruguay | 16.4 /100 | #210 | Poor $82,560 |
| Salvadorans | 15.4 /100 | #211 | Poor $82,449 |
| Venezuelans | 15.3 /100 | #212 | Poor $82,432 |
| Nepalese | 15.1 /100 | #213 | Poor $82,410 |
| Panamanians | 14.0 /100 | #214 | Poor $82,272 |
| Vietnamese | 13.8 /100 | #215 | Poor $82,248 |
| Yugoslavians | 13.3 /100 | #216 | Poor $82,186 |
Demographics Similar to Arapaho by Median Household Income
In terms of median household income, the demographic groups most similar to Arapaho are Native/Alaskan ($67,879, a difference of 0.13%), Sioux ($67,792, a difference of 0.25%), Creek ($67,715, a difference of 0.37%), Black/African American ($67,573, a difference of 0.58%), and Dutch West Indian ($68,412, a difference of 0.66%).
| Demographics | Rating | Rank | Median Household Income |
| Bahamians | 0.0 /100 | #323 | Tragic $69,726 |
| Yup'ik | 0.0 /100 | #324 | Tragic $69,695 |
| Seminole | 0.0 /100 | #325 | Tragic $69,420 |
| Yuman | 0.0 /100 | #326 | Tragic $68,743 |
| Immigrants | Cuba | 0.0 /100 | #327 | Tragic $68,461 |
| Menominee | 0.0 /100 | #328 | Tragic $68,423 |
| Dutch West Indians | 0.0 /100 | #329 | Tragic $68,412 |
| Arapaho | 0.0 /100 | #330 | Tragic $67,965 |
| Natives/Alaskans | 0.0 /100 | #331 | Tragic $67,879 |
| Sioux | 0.0 /100 | #332 | Tragic $67,792 |
| Creek | 0.0 /100 | #333 | Tragic $67,715 |
| Blacks/African Americans | 0.0 /100 | #334 | Tragic $67,573 |
| Cheyenne | 0.0 /100 | #335 | Tragic $66,974 |
| Immigrants | Congo | 0.0 /100 | #336 | Tragic $66,768 |
| Kiowa | 0.0 /100 | #337 | Tragic $65,914 |