Immigrants from Iraq vs Cheyenne 6th Grade
COMPARE
Immigrants from Iraq
Cheyenne
6th Grade
6th Grade Comparison
Immigrants from Iraq
Cheyenne
96.8%
6TH GRADE
9.2/ 100
METRIC RATING
211th/ 347
METRIC RANK
97.5%
6TH GRADE
97.9/ 100
METRIC RATING
105th/ 347
METRIC RANK
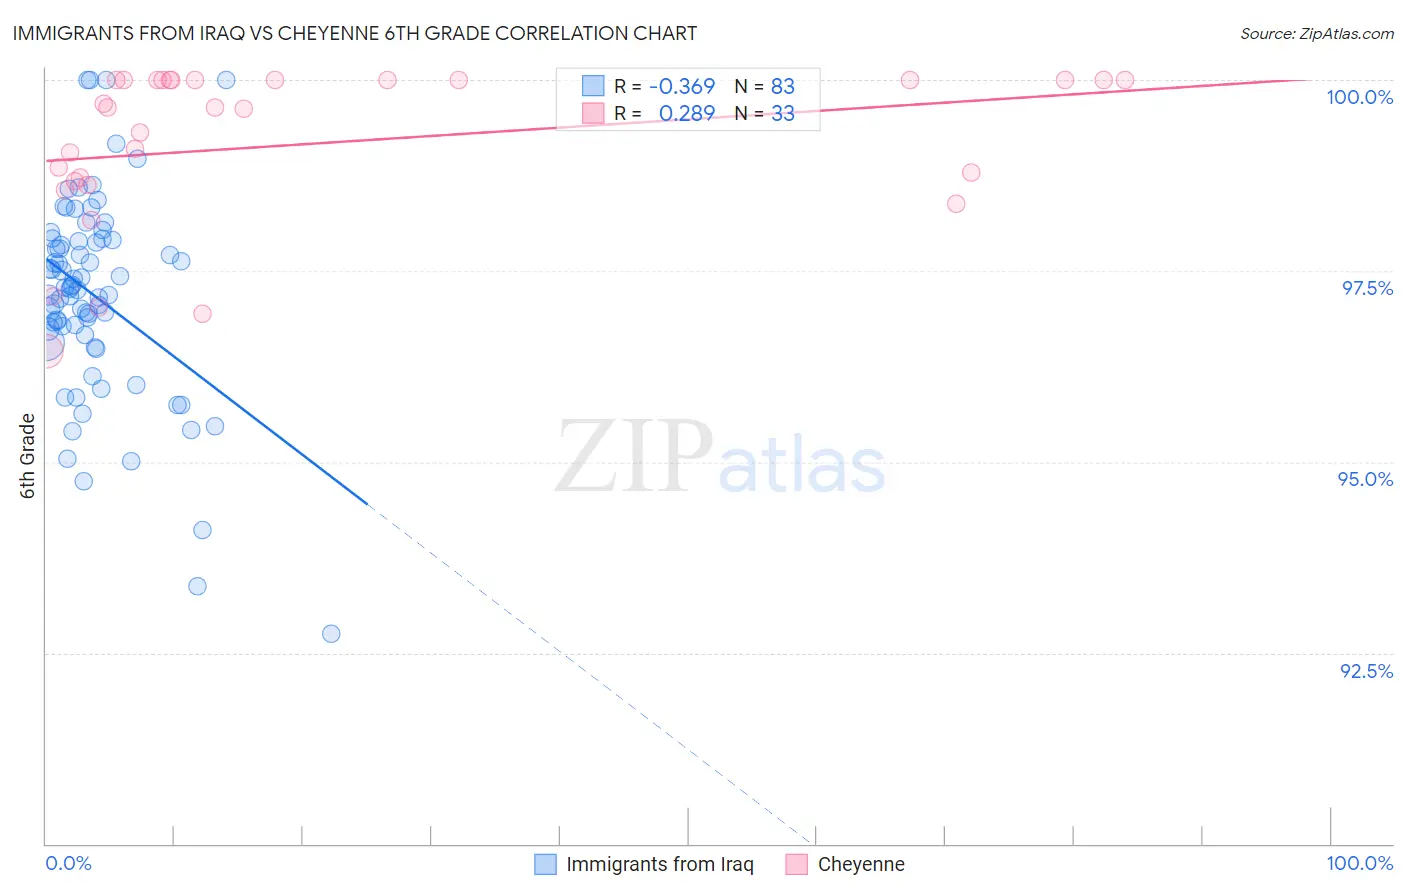
Immigrants from Iraq vs Cheyenne 6th Grade Correlation Chart
The statistical analysis conducted on geographies consisting of 194,632,332 people shows a mild negative correlation between the proportion of Immigrants from Iraq and percentage of population with at least 6th grade education in the United States with a correlation coefficient (R) of -0.369 and weighted average of 96.8%. Similarly, the statistical analysis conducted on geographies consisting of 80,716,760 people shows a weak positive correlation between the proportion of Cheyenne and percentage of population with at least 6th grade education in the United States with a correlation coefficient (R) of 0.289 and weighted average of 97.5%, a difference of 0.70%.
6th Grade Correlation Summary
| Measurement | Immigrants from Iraq | Cheyenne |
| Minimum | 92.8% | 96.5% |
| Maximum | 100.0% | 100.0% |
| Range | 7.2% | 3.5% |
| Mean | 97.2% | 99.2% |
| Median | 97.3% | 99.6% |
| Interquartile 25% (IQ1) | 96.7% | 98.7% |
| Interquartile 75% (IQ3) | 97.9% | 100.0% |
| Interquartile Range (IQR) | 1.2% | 1.3% |
| Standard Deviation (Sample) | 1.3% | 1.0% |
| Standard Deviation (Population) | 1.3% | 1.0% |
Similar Demographics by 6th Grade
Demographics Similar to Immigrants from Iraq by 6th Grade
In terms of 6th grade, the demographic groups most similar to Immigrants from Iraq are Moroccan (96.8%, a difference of 0.0%), Immigrants from Nepal (96.8%, a difference of 0.010%), Immigrants from Sudan (96.8%, a difference of 0.010%), Portuguese (96.8%, a difference of 0.010%), and Samoan (96.8%, a difference of 0.020%).
| Demographics | Rating | Rank | 6th Grade |
| Immigrants | Bahamas | 13.8 /100 | #204 | Poor 96.8% |
| Natives/Alaskans | 13.0 /100 | #205 | Poor 96.8% |
| Laotians | 11.8 /100 | #206 | Poor 96.8% |
| Iraqis | 11.7 /100 | #207 | Poor 96.8% |
| Samoans | 11.0 /100 | #208 | Poor 96.8% |
| Immigrants | Oceania | 11.0 /100 | #209 | Poor 96.8% |
| Immigrants | Nepal | 10.1 /100 | #210 | Poor 96.8% |
| Immigrants | Iraq | 9.2 /100 | #211 | Tragic 96.8% |
| Moroccans | 9.0 /100 | #212 | Tragic 96.8% |
| Immigrants | Sudan | 8.7 /100 | #213 | Tragic 96.8% |
| Portuguese | 8.2 /100 | #214 | Tragic 96.8% |
| Sierra Leoneans | 8.0 /100 | #215 | Tragic 96.8% |
| Paiute | 7.8 /100 | #216 | Tragic 96.8% |
| Liberians | 7.5 /100 | #217 | Tragic 96.8% |
| Navajo | 7.3 /100 | #218 | Tragic 96.8% |
Demographics Similar to Cheyenne by 6th Grade
In terms of 6th grade, the demographic groups most similar to Cheyenne are Bhutanese (97.5%, a difference of 0.0%), German Russian (97.5%, a difference of 0.0%), Choctaw (97.5%, a difference of 0.010%), Menominee (97.5%, a difference of 0.010%), and Turkish (97.5%, a difference of 0.020%).
| Demographics | Rating | Rank | 6th Grade |
| Immigrants | Denmark | 98.5 /100 | #98 | Exceptional 97.5% |
| Yugoslavians | 98.5 /100 | #99 | Exceptional 97.5% |
| Turks | 98.3 /100 | #100 | Exceptional 97.5% |
| South Africans | 98.2 /100 | #101 | Exceptional 97.5% |
| Choctaw | 98.0 /100 | #102 | Exceptional 97.5% |
| Bhutanese | 98.0 /100 | #103 | Exceptional 97.5% |
| German Russians | 97.9 /100 | #104 | Exceptional 97.5% |
| Cheyenne | 97.9 /100 | #105 | Exceptional 97.5% |
| Menominee | 97.7 /100 | #106 | Exceptional 97.5% |
| Immigrants | Singapore | 97.6 /100 | #107 | Exceptional 97.5% |
| Immigrants | Nonimmigrants | 97.3 /100 | #108 | Exceptional 97.4% |
| Immigrants | Czechoslovakia | 97.3 /100 | #109 | Exceptional 97.4% |
| Thais | 96.9 /100 | #110 | Exceptional 97.4% |
| Iroquois | 96.9 /100 | #111 | Exceptional 97.4% |
| Immigrants | Latvia | 96.7 /100 | #112 | Exceptional 97.4% |