Immigrants from India vs Argentinean Median Earnings
COMPARE
Immigrants from India
Argentinean
Median Earnings
Median Earnings Comparison
Immigrants from India
Argentineans
$60,648
MEDIAN EARNINGS
100.0/ 100
METRIC RATING
3rd/ 347
METRIC RANK
$50,399
MEDIAN EARNINGS
99.6/ 100
METRIC RATING
78th/ 347
METRIC RANK
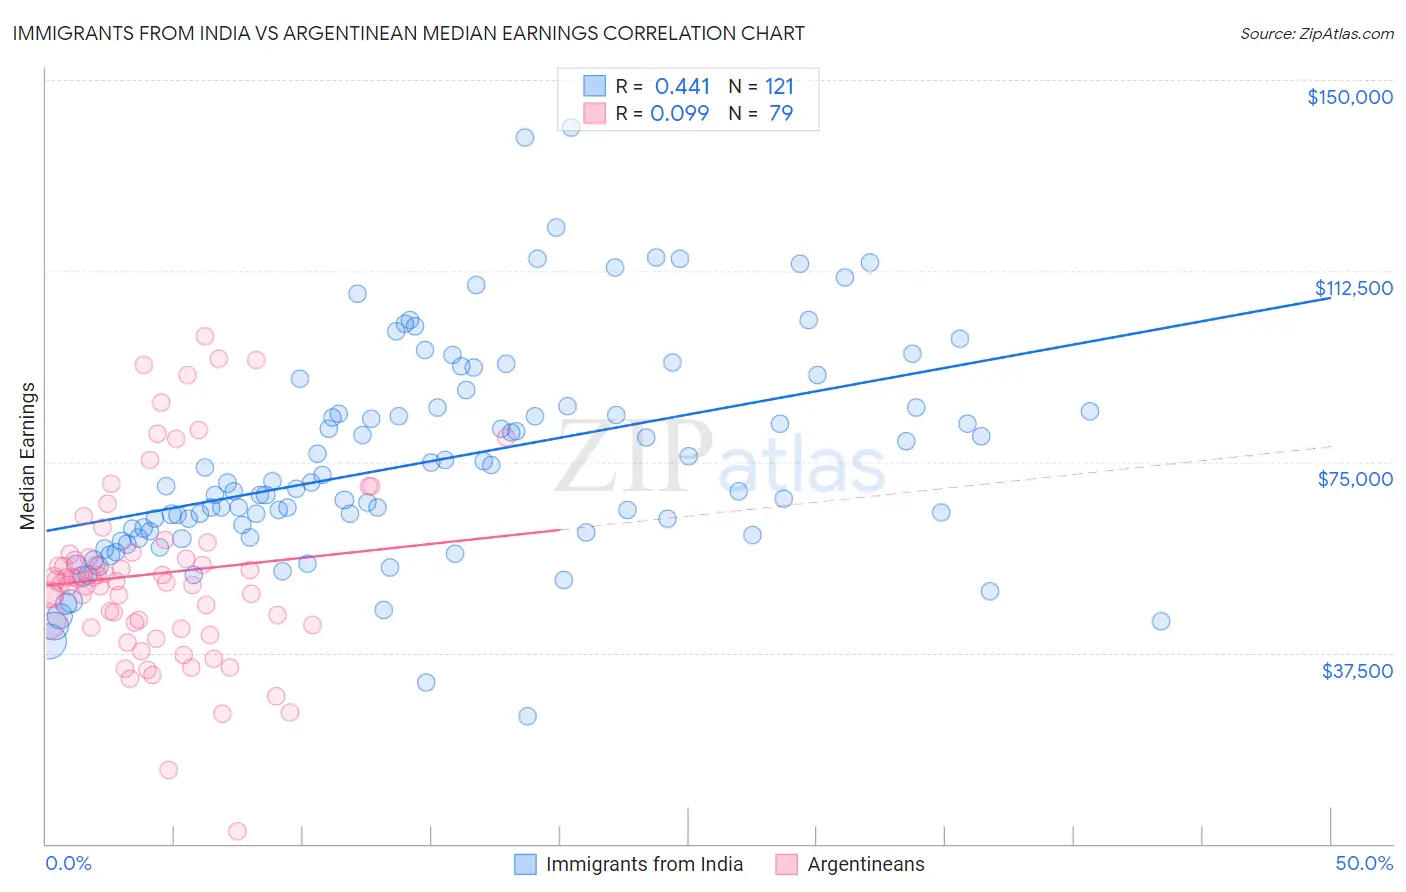
Immigrants from India vs Argentinean Median Earnings Correlation Chart
The statistical analysis conducted on geographies consisting of 434,105,381 people shows a moderate positive correlation between the proportion of Immigrants from India and median earnings in the United States with a correlation coefficient (R) of 0.441 and weighted average of $60,648. Similarly, the statistical analysis conducted on geographies consisting of 297,136,392 people shows a slight positive correlation between the proportion of Argentineans and median earnings in the United States with a correlation coefficient (R) of 0.099 and weighted average of $50,399, a difference of 20.3%.
Median Earnings Correlation Summary
| Measurement | Immigrants from India | Argentinean |
| Minimum | $24,957 | $2,499 |
| Maximum | $140,742 | $99,706 |
| Range | $115,785 | $97,207 |
| Mean | $74,941 | $53,044 |
| Median | $69,769 | $51,898 |
| Interquartile 25% (IQ1) | $60,363 | $42,917 |
| Interquartile 75% (IQ3) | $85,753 | $57,109 |
| Interquartile Range (IQR) | $25,390 | $14,192 |
| Standard Deviation (Sample) | $21,309 | $18,063 |
| Standard Deviation (Population) | $21,220 | $17,948 |
Similar Demographics by Median Earnings
Demographics Similar to Immigrants from India by Median Earnings
In terms of median earnings, the demographic groups most similar to Immigrants from India are Immigrants from Taiwan ($61,151, a difference of 0.83%), Filipino ($61,197, a difference of 0.91%), Immigrants from Hong Kong ($59,433, a difference of 2.0%), Thai ($59,237, a difference of 2.4%), and Immigrants from Singapore ($59,038, a difference of 2.7%).
| Demographics | Rating | Rank | Median Earnings |
| Filipinos | 100.0 /100 | #1 | Exceptional $61,197 |
| Immigrants | Taiwan | 100.0 /100 | #2 | Exceptional $61,151 |
| Immigrants | India | 100.0 /100 | #3 | Exceptional $60,648 |
| Immigrants | Hong Kong | 100.0 /100 | #4 | Exceptional $59,433 |
| Thais | 100.0 /100 | #5 | Exceptional $59,237 |
| Immigrants | Singapore | 100.0 /100 | #6 | Exceptional $59,038 |
| Iranians | 100.0 /100 | #7 | Exceptional $58,474 |
| Immigrants | Iran | 100.0 /100 | #8 | Exceptional $57,612 |
| Okinawans | 100.0 /100 | #9 | Exceptional $57,550 |
| Immigrants | South Central Asia | 100.0 /100 | #10 | Exceptional $57,114 |
| Immigrants | Israel | 100.0 /100 | #11 | Exceptional $57,034 |
| Immigrants | Ireland | 100.0 /100 | #12 | Exceptional $56,854 |
| Immigrants | China | 100.0 /100 | #13 | Exceptional $56,638 |
| Immigrants | Australia | 100.0 /100 | #14 | Exceptional $56,305 |
| Indians (Asian) | 100.0 /100 | #15 | Exceptional $56,253 |
Demographics Similar to Argentineans by Median Earnings
In terms of median earnings, the demographic groups most similar to Argentineans are Laotian ($50,343, a difference of 0.11%), Ukrainian ($50,320, a difference of 0.16%), Immigrants from Southern Europe ($50,280, a difference of 0.24%), Immigrants from Moldova ($50,274, a difference of 0.25%), and Immigrants from Western Europe ($50,549, a difference of 0.30%).
| Demographics | Rating | Rank | Median Earnings |
| Immigrants | Ukraine | 99.8 /100 | #71 | Exceptional $50,984 |
| Immigrants | Egypt | 99.8 /100 | #72 | Exceptional $50,901 |
| Immigrants | Netherlands | 99.8 /100 | #73 | Exceptional $50,818 |
| South Africans | 99.8 /100 | #74 | Exceptional $50,752 |
| Immigrants | Scotland | 99.8 /100 | #75 | Exceptional $50,741 |
| Immigrants | Italy | 99.7 /100 | #76 | Exceptional $50,581 |
| Immigrants | Western Europe | 99.7 /100 | #77 | Exceptional $50,549 |
| Argentineans | 99.6 /100 | #78 | Exceptional $50,399 |
| Laotians | 99.6 /100 | #79 | Exceptional $50,343 |
| Ukrainians | 99.6 /100 | #80 | Exceptional $50,320 |
| Immigrants | Southern Europe | 99.6 /100 | #81 | Exceptional $50,280 |
| Immigrants | Moldova | 99.5 /100 | #82 | Exceptional $50,274 |
| Romanians | 99.5 /100 | #83 | Exceptional $50,244 |
| Immigrants | Hungary | 99.5 /100 | #84 | Exceptional $50,227 |
| Immigrants | Kazakhstan | 99.5 /100 | #85 | Exceptional $50,225 |