Immigrants from India vs Immigrants from Ukraine Median Earnings
COMPARE
Immigrants from India
Immigrants from Ukraine
Median Earnings
Median Earnings Comparison
Immigrants from India
Immigrants from Ukraine
$60,648
MEDIAN EARNINGS
100.0/ 100
METRIC RATING
3rd/ 347
METRIC RANK
$50,984
MEDIAN EARNINGS
99.8/ 100
METRIC RATING
71st/ 347
METRIC RANK
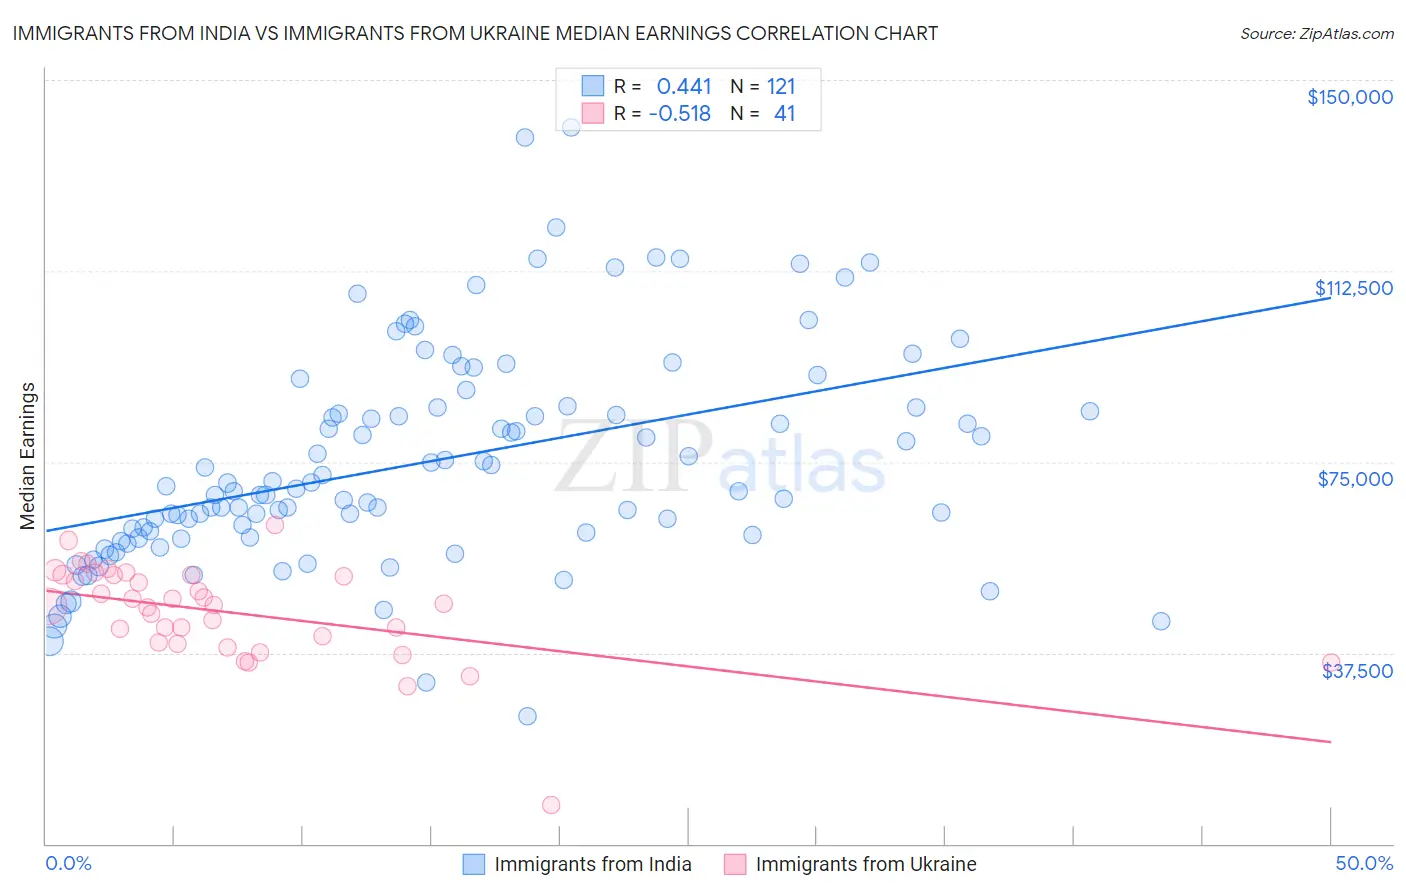
Immigrants from India vs Immigrants from Ukraine Median Earnings Correlation Chart
The statistical analysis conducted on geographies consisting of 434,105,381 people shows a moderate positive correlation between the proportion of Immigrants from India and median earnings in the United States with a correlation coefficient (R) of 0.441 and weighted average of $60,648. Similarly, the statistical analysis conducted on geographies consisting of 289,705,710 people shows a substantial negative correlation between the proportion of Immigrants from Ukraine and median earnings in the United States with a correlation coefficient (R) of -0.518 and weighted average of $50,984, a difference of 19.0%.
Median Earnings Correlation Summary
| Measurement | Immigrants from India | Immigrants from Ukraine |
| Minimum | $24,957 | $7,500 |
| Maximum | $140,742 | $62,500 |
| Range | $115,785 | $55,000 |
| Mean | $74,941 | $45,386 |
| Median | $69,769 | $46,915 |
| Interquartile 25% (IQ1) | $60,363 | $39,380 |
| Interquartile 75% (IQ3) | $85,753 | $52,800 |
| Interquartile Range (IQR) | $25,390 | $13,420 |
| Standard Deviation (Sample) | $21,309 | $9,626 |
| Standard Deviation (Population) | $21,220 | $9,508 |
Similar Demographics by Median Earnings
Demographics Similar to Immigrants from India by Median Earnings
In terms of median earnings, the demographic groups most similar to Immigrants from India are Immigrants from Taiwan ($61,151, a difference of 0.83%), Filipino ($61,197, a difference of 0.91%), Immigrants from Hong Kong ($59,433, a difference of 2.0%), Thai ($59,237, a difference of 2.4%), and Immigrants from Singapore ($59,038, a difference of 2.7%).
| Demographics | Rating | Rank | Median Earnings |
| Filipinos | 100.0 /100 | #1 | Exceptional $61,197 |
| Immigrants | Taiwan | 100.0 /100 | #2 | Exceptional $61,151 |
| Immigrants | India | 100.0 /100 | #3 | Exceptional $60,648 |
| Immigrants | Hong Kong | 100.0 /100 | #4 | Exceptional $59,433 |
| Thais | 100.0 /100 | #5 | Exceptional $59,237 |
| Immigrants | Singapore | 100.0 /100 | #6 | Exceptional $59,038 |
| Iranians | 100.0 /100 | #7 | Exceptional $58,474 |
| Immigrants | Iran | 100.0 /100 | #8 | Exceptional $57,612 |
| Okinawans | 100.0 /100 | #9 | Exceptional $57,550 |
| Immigrants | South Central Asia | 100.0 /100 | #10 | Exceptional $57,114 |
| Immigrants | Israel | 100.0 /100 | #11 | Exceptional $57,034 |
| Immigrants | Ireland | 100.0 /100 | #12 | Exceptional $56,854 |
| Immigrants | China | 100.0 /100 | #13 | Exceptional $56,638 |
| Immigrants | Australia | 100.0 /100 | #14 | Exceptional $56,305 |
| Indians (Asian) | 100.0 /100 | #15 | Exceptional $56,253 |
Demographics Similar to Immigrants from Ukraine by Median Earnings
In terms of median earnings, the demographic groups most similar to Immigrants from Ukraine are Lithuanian ($50,991, a difference of 0.010%), Mongolian ($51,038, a difference of 0.10%), Paraguayan ($51,068, a difference of 0.16%), Immigrants from Egypt ($50,901, a difference of 0.16%), and Immigrants from Spain ($51,092, a difference of 0.21%).
| Demographics | Rating | Rank | Median Earnings |
| New Zealanders | 99.9 /100 | #64 | Exceptional $51,246 |
| Greeks | 99.9 /100 | #65 | Exceptional $51,164 |
| Afghans | 99.9 /100 | #66 | Exceptional $51,112 |
| Immigrants | Spain | 99.9 /100 | #67 | Exceptional $51,092 |
| Paraguayans | 99.9 /100 | #68 | Exceptional $51,068 |
| Mongolians | 99.8 /100 | #69 | Exceptional $51,038 |
| Lithuanians | 99.8 /100 | #70 | Exceptional $50,991 |
| Immigrants | Ukraine | 99.8 /100 | #71 | Exceptional $50,984 |
| Immigrants | Egypt | 99.8 /100 | #72 | Exceptional $50,901 |
| Immigrants | Netherlands | 99.8 /100 | #73 | Exceptional $50,818 |
| South Africans | 99.8 /100 | #74 | Exceptional $50,752 |
| Immigrants | Scotland | 99.8 /100 | #75 | Exceptional $50,741 |
| Immigrants | Italy | 99.7 /100 | #76 | Exceptional $50,581 |
| Immigrants | Western Europe | 99.7 /100 | #77 | Exceptional $50,549 |
| Argentineans | 99.6 /100 | #78 | Exceptional $50,399 |