Immigrants from India vs Argentinean 10th Grade
COMPARE
Immigrants from India
Argentinean
10th Grade
10th Grade Comparison
Immigrants from India
Argentineans
95.3%
10TH GRADE
99.9/ 100
METRIC RATING
36th/ 347
METRIC RANK
93.7%
10TH GRADE
50.0/ 100
METRIC RATING
174th/ 347
METRIC RANK
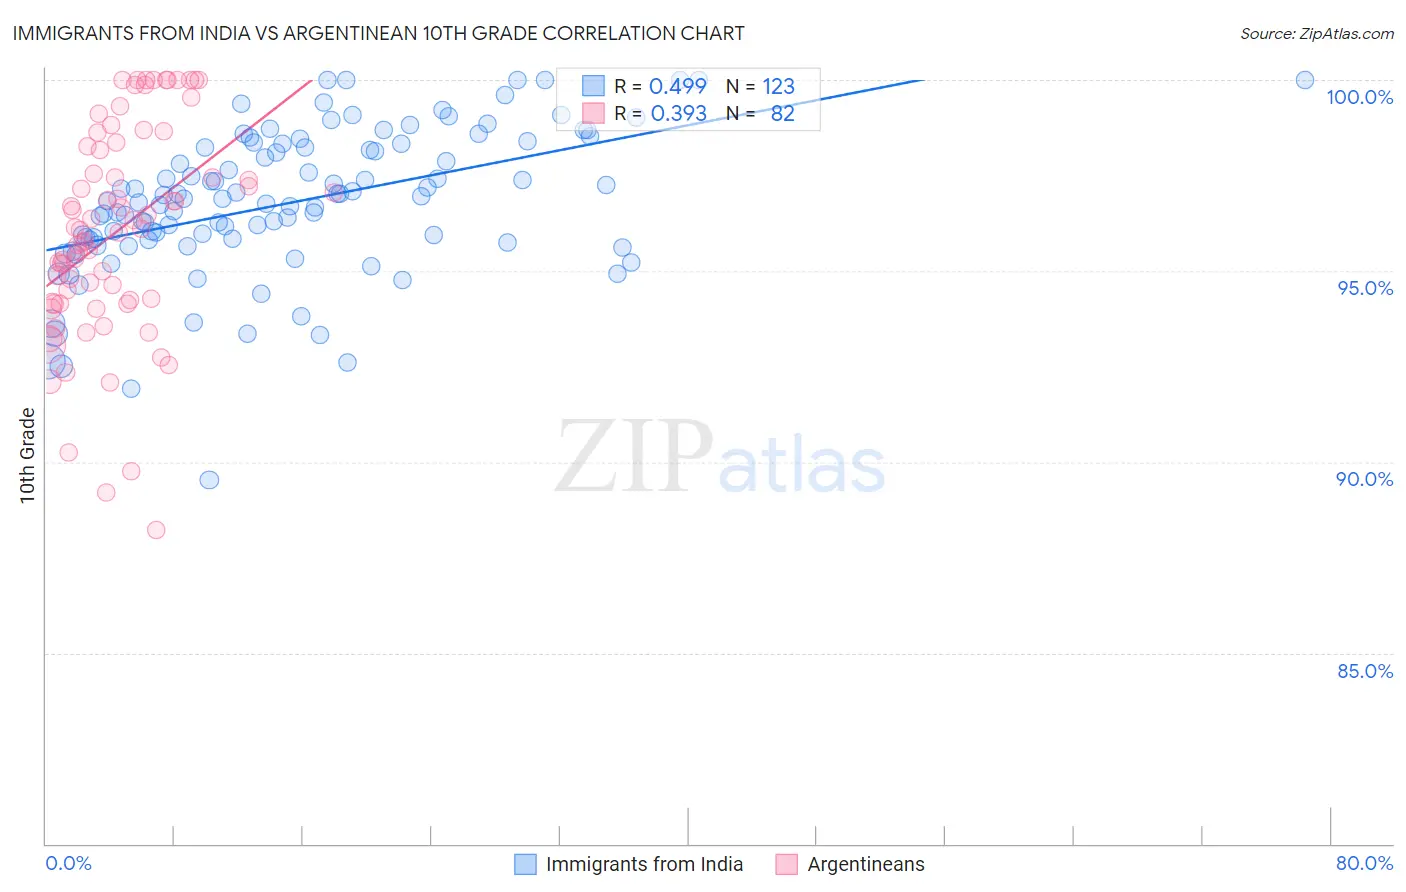
Immigrants from India vs Argentinean 10th Grade Correlation Chart
The statistical analysis conducted on geographies consisting of 434,105,844 people shows a moderate positive correlation between the proportion of Immigrants from India and percentage of population with at least 10th grade education in the United States with a correlation coefficient (R) of 0.499 and weighted average of 95.3%. Similarly, the statistical analysis conducted on geographies consisting of 297,145,104 people shows a mild positive correlation between the proportion of Argentineans and percentage of population with at least 10th grade education in the United States with a correlation coefficient (R) of 0.393 and weighted average of 93.7%, a difference of 1.7%.
10th Grade Correlation Summary
| Measurement | Immigrants from India | Argentinean |
| Minimum | 89.5% | 88.2% |
| Maximum | 100.0% | 100.0% |
| Range | 10.5% | 11.8% |
| Mean | 96.8% | 96.0% |
| Median | 96.9% | 96.1% |
| Interquartile 25% (IQ1) | 95.8% | 94.2% |
| Interquartile 75% (IQ3) | 98.3% | 98.3% |
| Interquartile Range (IQR) | 2.5% | 4.1% |
| Standard Deviation (Sample) | 1.9% | 2.8% |
| Standard Deviation (Population) | 1.9% | 2.7% |
Similar Demographics by 10th Grade
Demographics Similar to Immigrants from India by 10th Grade
In terms of 10th grade, the demographic groups most similar to Immigrants from India are Estonian (95.3%, a difference of 0.010%), Hungarian (95.3%, a difference of 0.020%), French (95.3%, a difference of 0.020%), British (95.3%, a difference of 0.020%), and French Canadian (95.3%, a difference of 0.020%).
| Demographics | Rating | Rank | 10th Grade |
| Bulgarians | 100.0 /100 | #29 | Exceptional 95.4% |
| Belgians | 100.0 /100 | #30 | Exceptional 95.4% |
| Iranians | 100.0 /100 | #31 | Exceptional 95.3% |
| Hungarians | 100.0 /100 | #32 | Exceptional 95.3% |
| French | 100.0 /100 | #33 | Exceptional 95.3% |
| British | 99.9 /100 | #34 | Exceptional 95.3% |
| Estonians | 99.9 /100 | #35 | Exceptional 95.3% |
| Immigrants | India | 99.9 /100 | #36 | Exceptional 95.3% |
| French Canadians | 99.9 /100 | #37 | Exceptional 95.3% |
| Northern Europeans | 99.9 /100 | #38 | Exceptional 95.3% |
| Immigrants | Scotland | 99.9 /100 | #39 | Exceptional 95.2% |
| Scotch-Irish | 99.9 /100 | #40 | Exceptional 95.2% |
| Russians | 99.9 /100 | #41 | Exceptional 95.2% |
| Slavs | 99.9 /100 | #42 | Exceptional 95.2% |
| Macedonians | 99.9 /100 | #43 | Exceptional 95.2% |
Demographics Similar to Argentineans by 10th Grade
In terms of 10th grade, the demographic groups most similar to Argentineans are Spaniard (93.7%, a difference of 0.0%), Immigrants from Nepal (93.7%, a difference of 0.0%), French American Indian (93.7%, a difference of 0.010%), Immigrants from Albania (93.8%, a difference of 0.020%), and Immigrants from Venezuela (93.8%, a difference of 0.030%).
| Demographics | Rating | Rank | 10th Grade |
| Immigrants | Egypt | 62.3 /100 | #167 | Good 93.8% |
| Alsatians | 59.4 /100 | #168 | Average 93.8% |
| Immigrants | Spain | 55.9 /100 | #169 | Average 93.8% |
| Immigrants | Venezuela | 53.9 /100 | #170 | Average 93.8% |
| Immigrants | Albania | 52.4 /100 | #171 | Average 93.8% |
| French American Indians | 50.9 /100 | #172 | Average 93.7% |
| Spaniards | 50.3 /100 | #173 | Average 93.7% |
| Argentineans | 50.0 /100 | #174 | Average 93.7% |
| Immigrants | Nepal | 49.6 /100 | #175 | Average 93.7% |
| Immigrants | Argentina | 47.1 /100 | #176 | Average 93.7% |
| Immigrants | Lebanon | 47.1 /100 | #177 | Average 93.7% |
| Sierra Leoneans | 46.1 /100 | #178 | Average 93.7% |
| Paraguayans | 45.3 /100 | #179 | Average 93.7% |
| Blackfeet | 42.8 /100 | #180 | Average 93.7% |
| Immigrants | Northern Africa | 41.6 /100 | #181 | Average 93.7% |