Lebanese vs Argentinean Median Earnings
COMPARE
Lebanese
Argentinean
Median Earnings
Median Earnings Comparison
Lebanese
Argentineans
$48,226
MEDIAN EARNINGS
92.5/ 100
METRIC RATING
131st/ 347
METRIC RANK
$50,399
MEDIAN EARNINGS
99.6/ 100
METRIC RATING
78th/ 347
METRIC RANK
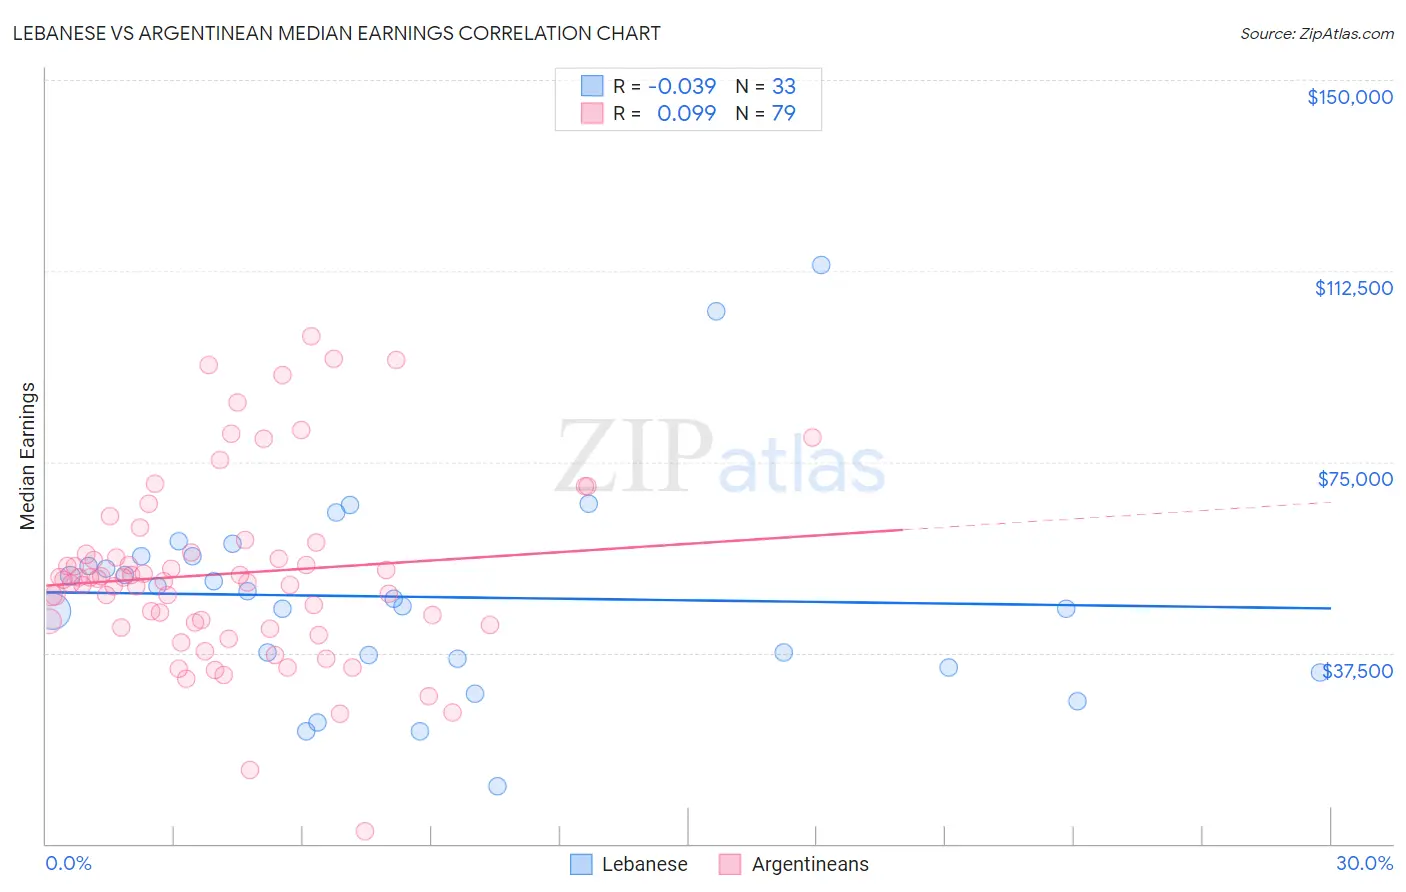
Lebanese vs Argentinean Median Earnings Correlation Chart
The statistical analysis conducted on geographies consisting of 401,606,109 people shows no correlation between the proportion of Lebanese and median earnings in the United States with a correlation coefficient (R) of -0.039 and weighted average of $48,226. Similarly, the statistical analysis conducted on geographies consisting of 297,136,392 people shows a slight positive correlation between the proportion of Argentineans and median earnings in the United States with a correlation coefficient (R) of 0.099 and weighted average of $50,399, a difference of 4.5%.
Median Earnings Correlation Summary
| Measurement | Lebanese | Argentinean |
| Minimum | $11,384 | $2,499 |
| Maximum | $113,646 | $99,706 |
| Range | $102,262 | $97,207 |
| Mean | $48,478 | $53,044 |
| Median | $48,125 | $51,898 |
| Interquartile 25% (IQ1) | $35,416 | $42,917 |
| Interquartile 75% (IQ3) | $56,506 | $57,109 |
| Interquartile Range (IQR) | $21,090 | $14,192 |
| Standard Deviation (Sample) | $20,869 | $18,063 |
| Standard Deviation (Population) | $20,550 | $17,948 |
Similar Demographics by Median Earnings
Demographics Similar to Lebanese by Median Earnings
In terms of median earnings, the demographic groups most similar to Lebanese are Zimbabwean ($48,229, a difference of 0.010%), Pakistani ($48,254, a difference of 0.060%), Immigrants from Philippines ($48,266, a difference of 0.080%), British ($48,189, a difference of 0.080%), and Sierra Leonean ($48,286, a difference of 0.12%).
| Demographics | Rating | Rank | Median Earnings |
| Brazilians | 93.7 /100 | #124 | Exceptional $48,356 |
| Immigrants | Fiji | 93.3 /100 | #125 | Exceptional $48,305 |
| Assyrians/Chaldeans/Syriacs | 93.3 /100 | #126 | Exceptional $48,304 |
| Sierra Leoneans | 93.1 /100 | #127 | Exceptional $48,286 |
| Immigrants | Philippines | 92.9 /100 | #128 | Exceptional $48,266 |
| Pakistanis | 92.8 /100 | #129 | Exceptional $48,254 |
| Zimbabweans | 92.6 /100 | #130 | Exceptional $48,229 |
| Lebanese | 92.5 /100 | #131 | Exceptional $48,226 |
| British | 92.2 /100 | #132 | Exceptional $48,189 |
| Immigrants | Uganda | 90.5 /100 | #133 | Exceptional $48,041 |
| Sri Lankans | 90.5 /100 | #134 | Exceptional $48,040 |
| Portuguese | 90.4 /100 | #135 | Exceptional $48,032 |
| Slovenes | 90.0 /100 | #136 | Excellent $47,995 |
| Immigrants | Nepal | 89.0 /100 | #137 | Excellent $47,925 |
| Europeans | 88.9 /100 | #138 | Excellent $47,915 |
Demographics Similar to Argentineans by Median Earnings
In terms of median earnings, the demographic groups most similar to Argentineans are Laotian ($50,343, a difference of 0.11%), Ukrainian ($50,320, a difference of 0.16%), Immigrants from Southern Europe ($50,280, a difference of 0.24%), Immigrants from Moldova ($50,274, a difference of 0.25%), and Immigrants from Western Europe ($50,549, a difference of 0.30%).
| Demographics | Rating | Rank | Median Earnings |
| Immigrants | Ukraine | 99.8 /100 | #71 | Exceptional $50,984 |
| Immigrants | Egypt | 99.8 /100 | #72 | Exceptional $50,901 |
| Immigrants | Netherlands | 99.8 /100 | #73 | Exceptional $50,818 |
| South Africans | 99.8 /100 | #74 | Exceptional $50,752 |
| Immigrants | Scotland | 99.8 /100 | #75 | Exceptional $50,741 |
| Immigrants | Italy | 99.7 /100 | #76 | Exceptional $50,581 |
| Immigrants | Western Europe | 99.7 /100 | #77 | Exceptional $50,549 |
| Argentineans | 99.6 /100 | #78 | Exceptional $50,399 |
| Laotians | 99.6 /100 | #79 | Exceptional $50,343 |
| Ukrainians | 99.6 /100 | #80 | Exceptional $50,320 |
| Immigrants | Southern Europe | 99.6 /100 | #81 | Exceptional $50,280 |
| Immigrants | Moldova | 99.5 /100 | #82 | Exceptional $50,274 |
| Romanians | 99.5 /100 | #83 | Exceptional $50,244 |
| Immigrants | Hungary | 99.5 /100 | #84 | Exceptional $50,227 |
| Immigrants | Kazakhstan | 99.5 /100 | #85 | Exceptional $50,225 |