Immigrants from India vs Argentinean Master's Degree
COMPARE
Immigrants from India
Argentinean
Master's Degree
Master's Degree Comparison
Immigrants from India
Argentineans
22.3%
MASTER'S DEGREE
100.0/ 100
METRIC RATING
6th/ 347
METRIC RANK
18.2%
MASTER'S DEGREE
99.9/ 100
METRIC RATING
62nd/ 347
METRIC RANK
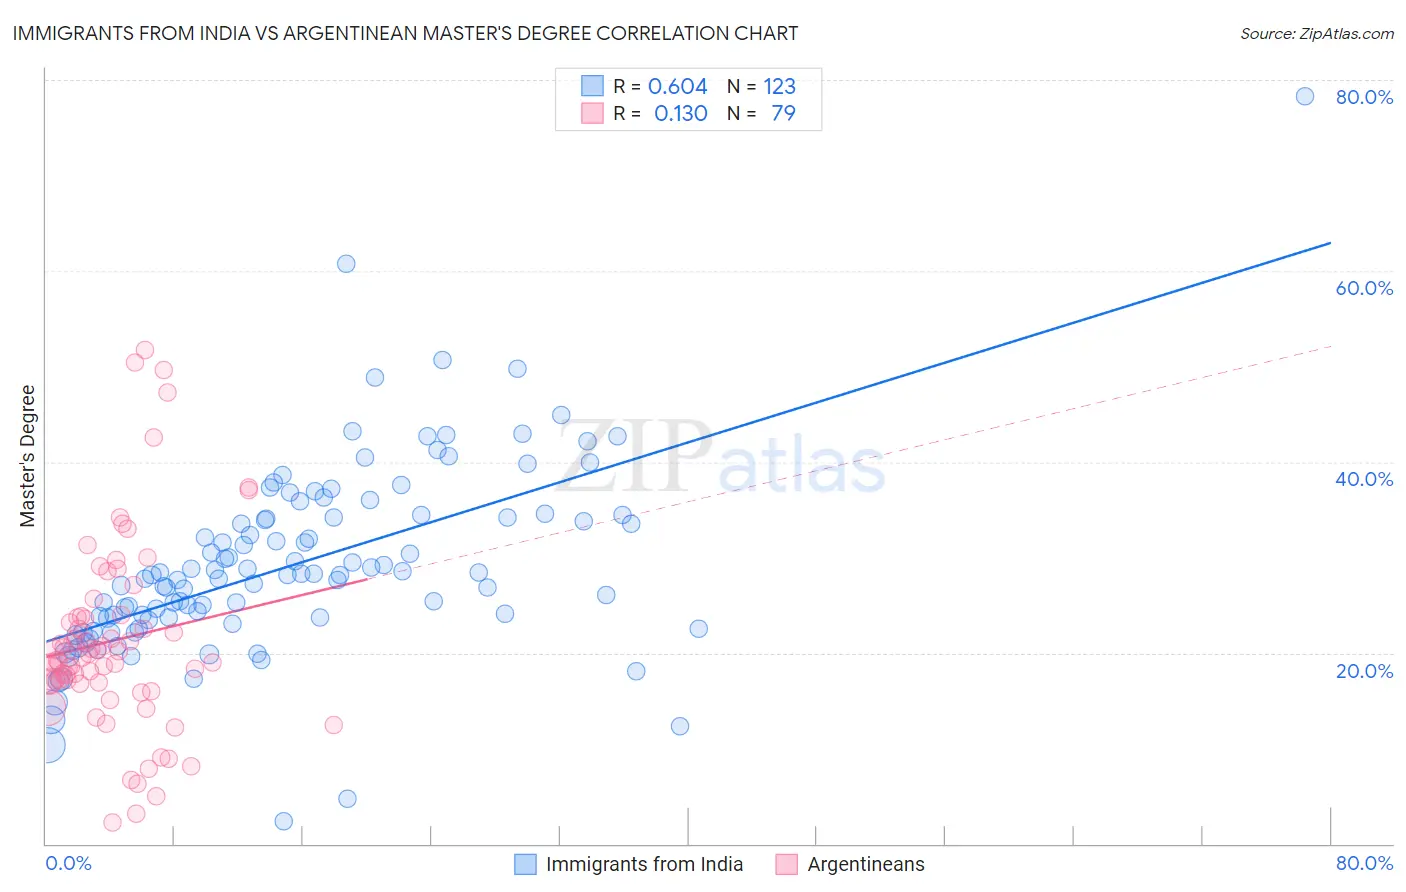
Immigrants from India vs Argentinean Master's Degree Correlation Chart
The statistical analysis conducted on geographies consisting of 433,961,661 people shows a significant positive correlation between the proportion of Immigrants from India and percentage of population with at least master's degree education in the United States with a correlation coefficient (R) of 0.604 and weighted average of 22.3%. Similarly, the statistical analysis conducted on geographies consisting of 297,078,027 people shows a poor positive correlation between the proportion of Argentineans and percentage of population with at least master's degree education in the United States with a correlation coefficient (R) of 0.130 and weighted average of 18.2%, a difference of 22.7%.
Master's Degree Correlation Summary
| Measurement | Immigrants from India | Argentinean |
| Minimum | 2.4% | 2.2% |
| Maximum | 78.4% | 51.7% |
| Range | 76.0% | 49.5% |
| Mean | 29.2% | 21.3% |
| Median | 28.2% | 19.5% |
| Interquartile 25% (IQ1) | 23.4% | 16.9% |
| Interquartile 75% (IQ3) | 34.2% | 23.8% |
| Interquartile Range (IQR) | 10.8% | 6.9% |
| Standard Deviation (Sample) | 10.1% | 10.1% |
| Standard Deviation (Population) | 10.0% | 10.0% |
Similar Demographics by Master's Degree
Demographics Similar to Immigrants from India by Master's Degree
In terms of master's degree, the demographic groups most similar to Immigrants from India are Iranian (22.3%, a difference of 0.21%), Immigrants from Taiwan (22.5%, a difference of 0.68%), Immigrants from Israel (22.6%, a difference of 1.5%), Okinawan (22.6%, a difference of 1.5%), and Cypriot (21.8%, a difference of 2.4%).
| Demographics | Rating | Rank | Master's Degree |
| Immigrants | Singapore | 100.0 /100 | #1 | Exceptional 23.4% |
| Filipinos | 100.0 /100 | #2 | Exceptional 23.4% |
| Immigrants | Israel | 100.0 /100 | #3 | Exceptional 22.6% |
| Okinawans | 100.0 /100 | #4 | Exceptional 22.6% |
| Immigrants | Taiwan | 100.0 /100 | #5 | Exceptional 22.5% |
| Immigrants | India | 100.0 /100 | #6 | Exceptional 22.3% |
| Iranians | 100.0 /100 | #7 | Exceptional 22.3% |
| Cypriots | 100.0 /100 | #8 | Exceptional 21.8% |
| Thais | 100.0 /100 | #9 | Exceptional 21.7% |
| Immigrants | Iran | 100.0 /100 | #10 | Exceptional 21.6% |
| Immigrants | China | 100.0 /100 | #11 | Exceptional 21.2% |
| Eastern Europeans | 100.0 /100 | #12 | Exceptional 21.1% |
| Immigrants | Australia | 100.0 /100 | #13 | Exceptional 20.9% |
| Immigrants | Switzerland | 100.0 /100 | #14 | Exceptional 20.9% |
| Immigrants | Eastern Asia | 100.0 /100 | #15 | Exceptional 20.8% |
Demographics Similar to Argentineans by Master's Degree
In terms of master's degree, the demographic groups most similar to Argentineans are Immigrants from Europe (18.2%, a difference of 0.36%), Immigrants from Netherlands (18.1%, a difference of 0.36%), South African (18.1%, a difference of 0.44%), New Zealander (18.3%, a difference of 0.51%), and Immigrants from Bulgaria (18.3%, a difference of 0.74%).
| Demographics | Rating | Rank | Master's Degree |
| Immigrants | Serbia | 99.9 /100 | #55 | Exceptional 18.5% |
| Asians | 99.9 /100 | #56 | Exceptional 18.4% |
| Immigrants | Asia | 99.9 /100 | #57 | Exceptional 18.4% |
| Australians | 99.9 /100 | #58 | Exceptional 18.4% |
| Immigrants | Bulgaria | 99.9 /100 | #59 | Exceptional 18.3% |
| New Zealanders | 99.9 /100 | #60 | Exceptional 18.3% |
| Immigrants | Europe | 99.9 /100 | #61 | Exceptional 18.2% |
| Argentineans | 99.9 /100 | #62 | Exceptional 18.2% |
| Immigrants | Netherlands | 99.9 /100 | #63 | Exceptional 18.1% |
| South Africans | 99.9 /100 | #64 | Exceptional 18.1% |
| Immigrants | Kazakhstan | 99.8 /100 | #65 | Exceptional 18.0% |
| Ethiopians | 99.8 /100 | #66 | Exceptional 18.0% |
| Immigrants | Argentina | 99.8 /100 | #67 | Exceptional 18.0% |
| Immigrants | Ethiopia | 99.8 /100 | #68 | Exceptional 17.9% |
| Immigrants | Uzbekistan | 99.8 /100 | #69 | Exceptional 17.9% |