Immigrants from Hungary vs Immigrants from Liberia Doctorate Degree
COMPARE
Immigrants from Hungary
Immigrants from Liberia
Doctorate Degree
Doctorate Degree Comparison
Immigrants from Hungary
Immigrants from Liberia
2.2%
DOCTORATE DEGREE
99.8/ 100
METRIC RATING
76th/ 347
METRIC RANK
1.5%
DOCTORATE DEGREE
0.5/ 100
METRIC RATING
266th/ 347
METRIC RANK
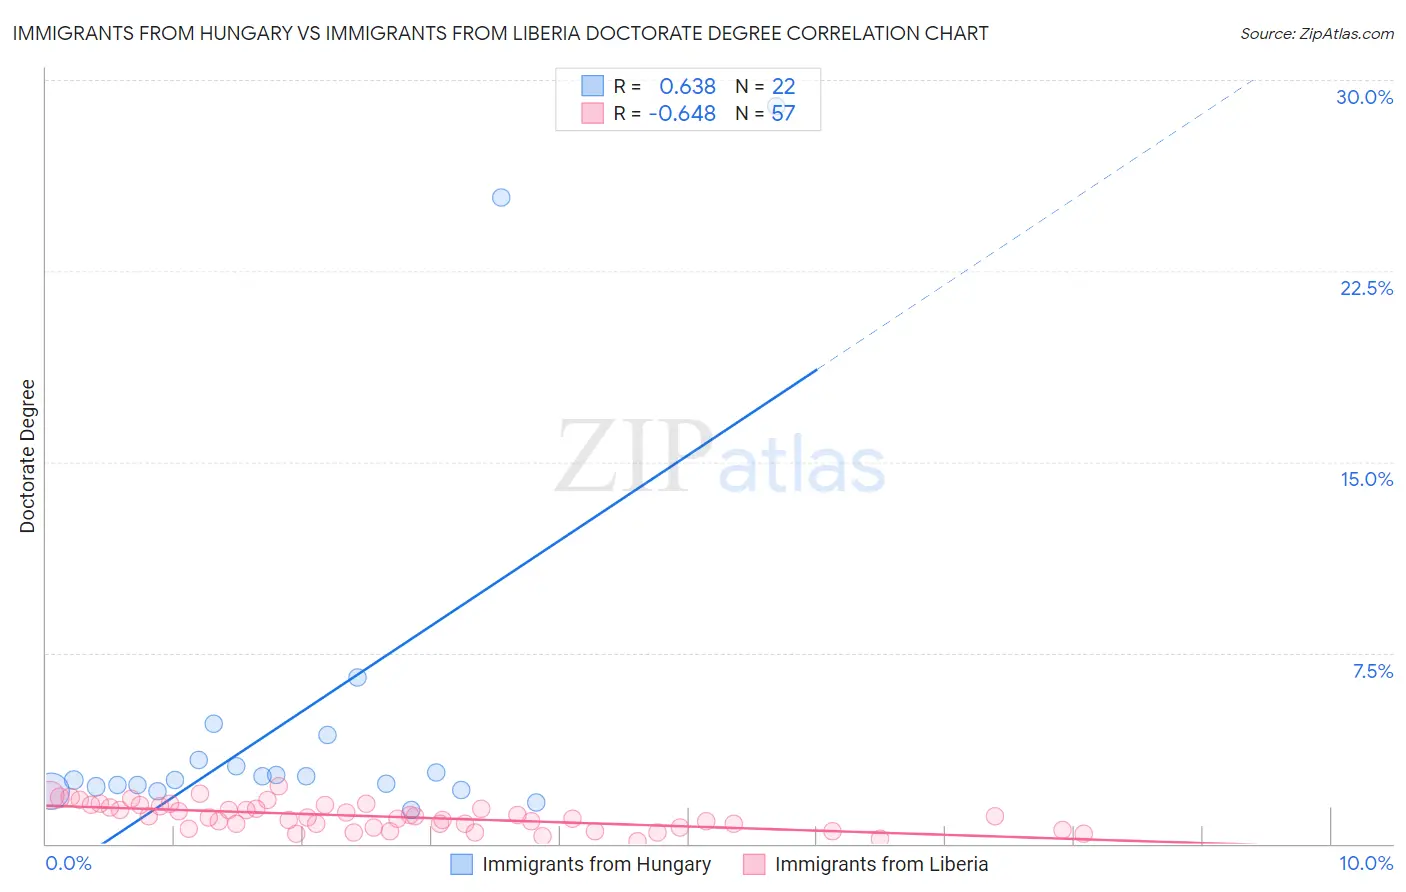
Immigrants from Hungary vs Immigrants from Liberia Doctorate Degree Correlation Chart
The statistical analysis conducted on geographies consisting of 195,058,211 people shows a significant positive correlation between the proportion of Immigrants from Hungary and percentage of population with at least doctorate degree education in the United States with a correlation coefficient (R) of 0.638 and weighted average of 2.2%. Similarly, the statistical analysis conducted on geographies consisting of 134,868,003 people shows a significant negative correlation between the proportion of Immigrants from Liberia and percentage of population with at least doctorate degree education in the United States with a correlation coefficient (R) of -0.648 and weighted average of 1.5%, a difference of 50.9%.
Doctorate Degree Correlation Summary
| Measurement | Immigrants from Hungary | Immigrants from Liberia |
| Minimum | 1.3% | 0.100% |
| Maximum | 29.0% | 2.2% |
| Range | 27.7% | 2.1% |
| Mean | 5.0% | 1.1% |
| Median | 2.6% | 1.0% |
| Interquartile 25% (IQ1) | 2.2% | 0.64% |
| Interquartile 75% (IQ3) | 3.3% | 1.5% |
| Interquartile Range (IQR) | 1.1% | 0.85% |
| Standard Deviation (Sample) | 7.3% | 0.51% |
| Standard Deviation (Population) | 7.1% | 0.50% |
Similar Demographics by Doctorate Degree
Demographics Similar to Immigrants from Hungary by Doctorate Degree
In terms of doctorate degree, the demographic groups most similar to Immigrants from Hungary are Immigrants from Lebanon (2.2%, a difference of 0.010%), Immigrants from Western Asia (2.2%, a difference of 0.070%), Immigrants from North America (2.2%, a difference of 0.18%), Immigrants from Bulgaria (2.3%, a difference of 0.31%), and Immigrants from Canada (2.3%, a difference of 0.40%).
| Demographics | Rating | Rank | Doctorate Degree |
| Carpatho Rusyns | 99.8 /100 | #69 | Exceptional 2.3% |
| Lithuanians | 99.8 /100 | #70 | Exceptional 2.3% |
| Immigrants | Bolivia | 99.8 /100 | #71 | Exceptional 2.3% |
| Immigrants | Canada | 99.8 /100 | #72 | Exceptional 2.3% |
| Immigrants | Bulgaria | 99.8 /100 | #73 | Exceptional 2.3% |
| Immigrants | North America | 99.8 /100 | #74 | Exceptional 2.2% |
| Immigrants | Western Asia | 99.8 /100 | #75 | Exceptional 2.2% |
| Immigrants | Hungary | 99.8 /100 | #76 | Exceptional 2.2% |
| Immigrants | Lebanon | 99.8 /100 | #77 | Exceptional 2.2% |
| Immigrants | Belarus | 99.7 /100 | #78 | Exceptional 2.2% |
| Northern Europeans | 99.7 /100 | #79 | Exceptional 2.2% |
| Ugandans | 99.7 /100 | #80 | Exceptional 2.2% |
| Immigrants | Argentina | 99.7 /100 | #81 | Exceptional 2.2% |
| Immigrants | Uganda | 99.6 /100 | #82 | Exceptional 2.2% |
| Immigrants | Lithuania | 99.6 /100 | #83 | Exceptional 2.2% |
Demographics Similar to Immigrants from Liberia by Doctorate Degree
In terms of doctorate degree, the demographic groups most similar to Immigrants from Liberia are Kiowa (1.5%, a difference of 0.65%), U.S. Virgin Islander (1.5%, a difference of 0.65%), Crow (1.5%, a difference of 0.74%), Salvadoran (1.5%, a difference of 0.77%), and Nicaraguan (1.5%, a difference of 0.78%).
| Demographics | Rating | Rank | Doctorate Degree |
| Liberians | 0.9 /100 | #259 | Tragic 1.5% |
| Japanese | 0.9 /100 | #260 | Tragic 1.5% |
| Immigrants | Portugal | 0.8 /100 | #261 | Tragic 1.5% |
| Chickasaw | 0.7 /100 | #262 | Tragic 1.5% |
| Immigrants | Bahamas | 0.7 /100 | #263 | Tragic 1.5% |
| Blackfeet | 0.7 /100 | #264 | Tragic 1.5% |
| Nicaraguans | 0.6 /100 | #265 | Tragic 1.5% |
| Immigrants | Liberia | 0.5 /100 | #266 | Tragic 1.5% |
| Kiowa | 0.5 /100 | #267 | Tragic 1.5% |
| U.S. Virgin Islanders | 0.5 /100 | #268 | Tragic 1.5% |
| Crow | 0.5 /100 | #269 | Tragic 1.5% |
| Salvadorans | 0.5 /100 | #270 | Tragic 1.5% |
| Immigrants | Trinidad and Tobago | 0.5 /100 | #271 | Tragic 1.5% |
| Immigrants | Barbados | 0.4 /100 | #272 | Tragic 1.5% |
| Sioux | 0.4 /100 | #273 | Tragic 1.5% |