Immigrants from Bulgaria vs Tsimshian Median Earnings
COMPARE
Immigrants from Bulgaria
Tsimshian
Median Earnings
Median Earnings Comparison
Immigrants from Bulgaria
Tsimshian
$51,318
MEDIAN EARNINGS
99.9/ 100
METRIC RATING
63rd/ 347
METRIC RANK
$43,695
MEDIAN EARNINGS
2.1/ 100
METRIC RATING
251st/ 347
METRIC RANK
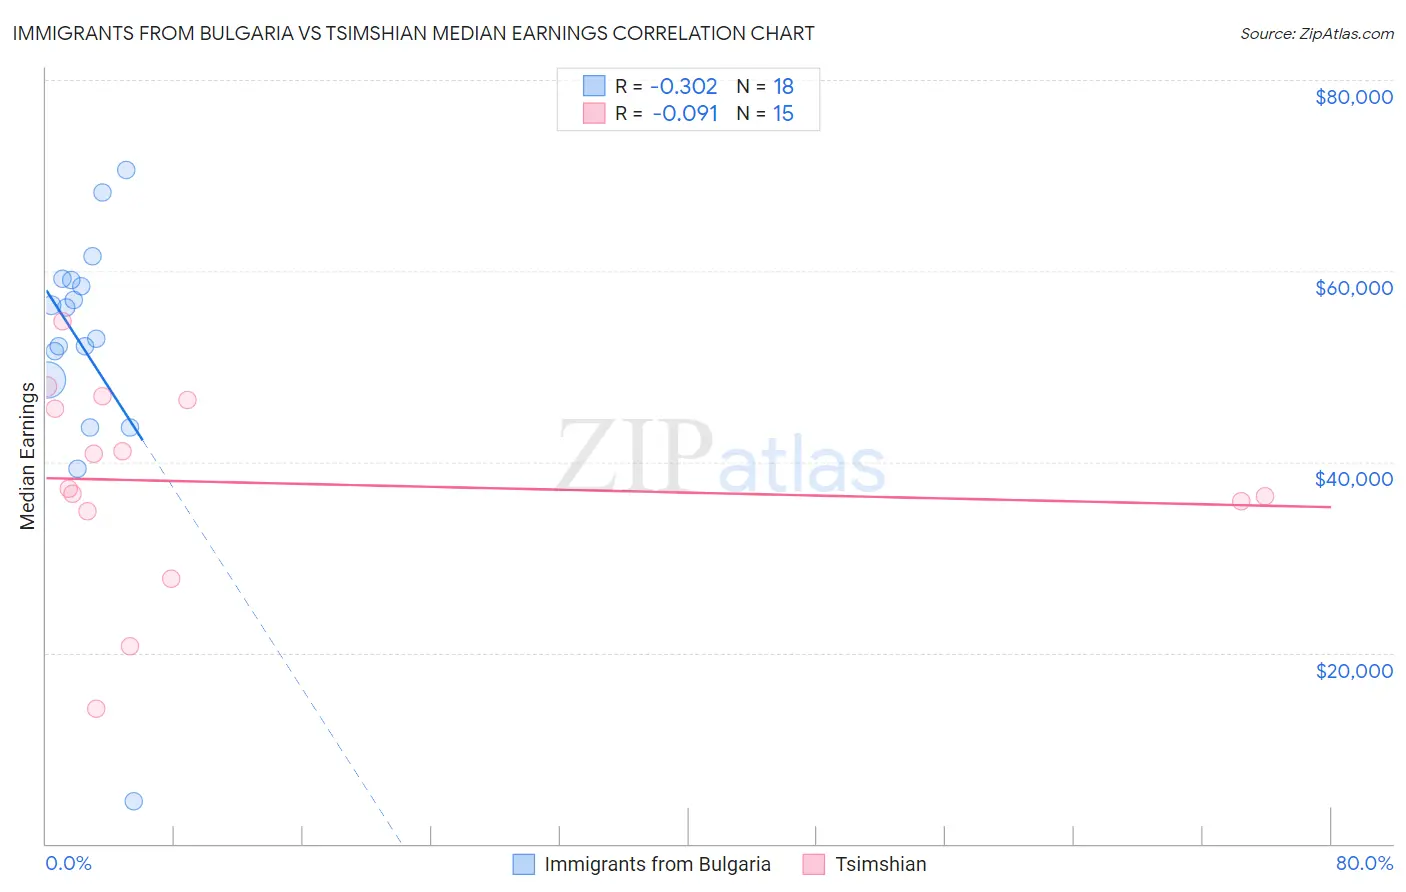
Immigrants from Bulgaria vs Tsimshian Median Earnings Correlation Chart
The statistical analysis conducted on geographies consisting of 172,536,651 people shows a mild negative correlation between the proportion of Immigrants from Bulgaria and median earnings in the United States with a correlation coefficient (R) of -0.302 and weighted average of $51,318. Similarly, the statistical analysis conducted on geographies consisting of 15,626,544 people shows a slight negative correlation between the proportion of Tsimshian and median earnings in the United States with a correlation coefficient (R) of -0.091 and weighted average of $43,695, a difference of 17.4%.
Median Earnings Correlation Summary
| Measurement | Immigrants from Bulgaria | Tsimshian |
| Minimum | $4,447 | $14,091 |
| Maximum | $70,600 | $54,691 |
| Range | $66,153 | $40,600 |
| Mean | $51,928 | $37,810 |
| Median | $54,557 | $37,241 |
| Interquartile 25% (IQ1) | $48,616 | $34,814 |
| Interquartile 75% (IQ3) | $58,987 | $46,528 |
| Interquartile Range (IQR) | $10,371 | $11,714 |
| Standard Deviation (Sample) | $14,304 | $10,670 |
| Standard Deviation (Population) | $13,901 | $10,309 |
Similar Demographics by Median Earnings
Demographics Similar to Immigrants from Bulgaria by Median Earnings
In terms of median earnings, the demographic groups most similar to Immigrants from Bulgaria are Immigrants from Romania ($51,337, a difference of 0.040%), New Zealander ($51,246, a difference of 0.14%), Greek ($51,164, a difference of 0.30%), Afghan ($51,112, a difference of 0.40%), and Immigrants from Spain ($51,092, a difference of 0.44%).
| Demographics | Rating | Rank | Median Earnings |
| Immigrants | Pakistan | 99.9 /100 | #56 | Exceptional $51,693 |
| Immigrants | Eastern Europe | 99.9 /100 | #57 | Exceptional $51,624 |
| Immigrants | Bolivia | 99.9 /100 | #58 | Exceptional $51,605 |
| Immigrants | Croatia | 99.9 /100 | #59 | Exceptional $51,581 |
| Immigrants | Serbia | 99.9 /100 | #60 | Exceptional $51,557 |
| Immigrants | Latvia | 99.9 /100 | #61 | Exceptional $51,555 |
| Immigrants | Romania | 99.9 /100 | #62 | Exceptional $51,337 |
| Immigrants | Bulgaria | 99.9 /100 | #63 | Exceptional $51,318 |
| New Zealanders | 99.9 /100 | #64 | Exceptional $51,246 |
| Greeks | 99.9 /100 | #65 | Exceptional $51,164 |
| Afghans | 99.9 /100 | #66 | Exceptional $51,112 |
| Immigrants | Spain | 99.9 /100 | #67 | Exceptional $51,092 |
| Paraguayans | 99.9 /100 | #68 | Exceptional $51,068 |
| Mongolians | 99.8 /100 | #69 | Exceptional $51,038 |
| Lithuanians | 99.8 /100 | #70 | Exceptional $50,991 |
Demographics Similar to Tsimshian by Median Earnings
In terms of median earnings, the demographic groups most similar to Tsimshian are Hawaiian ($43,673, a difference of 0.050%), Alaska Native ($43,750, a difference of 0.13%), Somali ($43,567, a difference of 0.30%), Malaysian ($43,844, a difference of 0.34%), and Liberian ($43,536, a difference of 0.37%).
| Demographics | Rating | Rank | Median Earnings |
| Immigrants | Nonimmigrants | 3.7 /100 | #244 | Tragic $44,117 |
| Immigrants | Burma/Myanmar | 3.2 /100 | #245 | Tragic $43,998 |
| Immigrants | West Indies | 3.1 /100 | #246 | Tragic $43,989 |
| Immigrants | Cabo Verde | 3.0 /100 | #247 | Tragic $43,963 |
| Nepalese | 2.6 /100 | #248 | Tragic $43,860 |
| Malaysians | 2.6 /100 | #249 | Tragic $43,844 |
| Alaska Natives | 2.3 /100 | #250 | Tragic $43,750 |
| Tsimshian | 2.1 /100 | #251 | Tragic $43,695 |
| Hawaiians | 2.0 /100 | #252 | Tragic $43,673 |
| Somalis | 1.8 /100 | #253 | Tragic $43,567 |
| Liberians | 1.7 /100 | #254 | Tragic $43,536 |
| Immigrants | Middle Africa | 1.4 /100 | #255 | Tragic $43,416 |
| Alaskan Athabascans | 1.4 /100 | #256 | Tragic $43,393 |
| Jamaicans | 1.3 /100 | #257 | Tragic $43,343 |
| French American Indians | 1.3 /100 | #258 | Tragic $43,333 |