Immigrants from Haiti vs Tsimshian Householder Income Over 65 years
COMPARE
Immigrants from Haiti
Tsimshian
Householder Income Over 65 years
Householder Income Over 65 years Comparison
Immigrants from Haiti
Tsimshian
$51,219
HOUSEHOLDER INCOME OVER 65 YEARS
0.0/ 100
METRIC RATING
325th/ 347
METRIC RANK
$58,202
HOUSEHOLDER INCOME OVER 65 YEARS
5.2/ 100
METRIC RATING
223rd/ 347
METRIC RANK
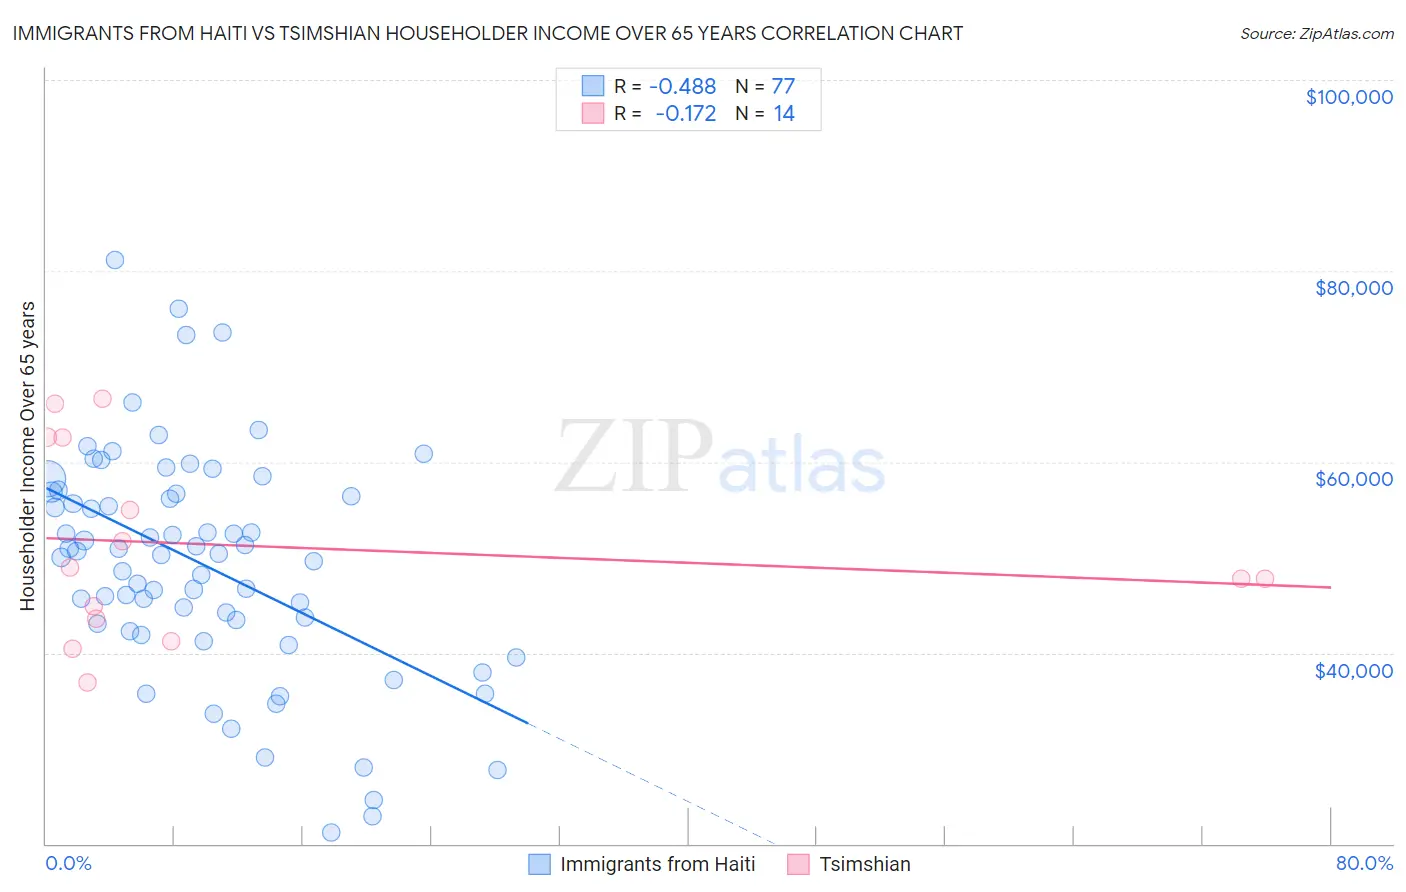
Immigrants from Haiti vs Tsimshian Householder Income Over 65 years Correlation Chart
The statistical analysis conducted on geographies consisting of 224,664,590 people shows a moderate negative correlation between the proportion of Immigrants from Haiti and household income with householder over the age of 65 in the United States with a correlation coefficient (R) of -0.488 and weighted average of $51,219. Similarly, the statistical analysis conducted on geographies consisting of 15,616,590 people shows a poor negative correlation between the proportion of Tsimshian and household income with householder over the age of 65 in the United States with a correlation coefficient (R) of -0.172 and weighted average of $58,202, a difference of 13.6%.
Householder Income Over 65 years Correlation Summary
| Measurement | Immigrants from Haiti | Tsimshian |
| Minimum | $21,207 | $36,937 |
| Maximum | $81,196 | $66,667 |
| Range | $59,989 | $29,730 |
| Mean | $49,285 | $51,164 |
| Median | $50,337 | $48,373 |
| Interquartile 25% (IQ1) | $42,656 | $43,571 |
| Interquartile 75% (IQ3) | $56,737 | $62,589 |
| Interquartile Range (IQR) | $14,081 | $19,018 |
| Standard Deviation (Sample) | $11,917 | $9,918 |
| Standard Deviation (Population) | $11,839 | $9,557 |
Similar Demographics by Householder Income Over 65 years
Demographics Similar to Immigrants from Haiti by Householder Income Over 65 years
In terms of householder income over 65 years, the demographic groups most similar to Immigrants from Haiti are Kiowa ($51,140, a difference of 0.15%), Immigrants from Congo ($51,393, a difference of 0.34%), Cajun ($51,397, a difference of 0.35%), Bahamian ($51,000, a difference of 0.43%), and British West Indian ($51,463, a difference of 0.47%).
| Demographics | Rating | Rank | Householder Income Over 65 years |
| Haitians | 0.0 /100 | #318 | Tragic $51,912 |
| Immigrants | Honduras | 0.0 /100 | #319 | Tragic $51,888 |
| Colville | 0.0 /100 | #320 | Tragic $51,739 |
| Menominee | 0.0 /100 | #321 | Tragic $51,719 |
| British West Indians | 0.0 /100 | #322 | Tragic $51,463 |
| Cajuns | 0.0 /100 | #323 | Tragic $51,397 |
| Immigrants | Congo | 0.0 /100 | #324 | Tragic $51,393 |
| Immigrants | Haiti | 0.0 /100 | #325 | Tragic $51,219 |
| Kiowa | 0.0 /100 | #326 | Tragic $51,140 |
| Bahamians | 0.0 /100 | #327 | Tragic $51,000 |
| Hopi | 0.0 /100 | #328 | Tragic $50,925 |
| Blacks/African Americans | 0.0 /100 | #329 | Tragic $50,779 |
| Immigrants | Grenada | 0.0 /100 | #330 | Tragic $50,747 |
| Pima | 0.0 /100 | #331 | Tragic $50,539 |
| Dutch West Indians | 0.0 /100 | #332 | Tragic $50,475 |
Demographics Similar to Tsimshian by Householder Income Over 65 years
In terms of householder income over 65 years, the demographic groups most similar to Tsimshian are Delaware ($58,214, a difference of 0.020%), Immigrants from El Salvador ($58,226, a difference of 0.040%), Bermudan ($58,171, a difference of 0.050%), Malaysian ($58,244, a difference of 0.070%), and Yugoslavian ($58,243, a difference of 0.070%).
| Demographics | Rating | Rank | Householder Income Over 65 years |
| Immigrants | Middle Africa | 6.2 /100 | #216 | Tragic $58,375 |
| Sudanese | 5.7 /100 | #217 | Tragic $58,281 |
| Panamanians | 5.6 /100 | #218 | Tragic $58,266 |
| Malaysians | 5.5 /100 | #219 | Tragic $58,244 |
| Yugoslavians | 5.5 /100 | #220 | Tragic $58,243 |
| Immigrants | El Salvador | 5.4 /100 | #221 | Tragic $58,226 |
| Delaware | 5.3 /100 | #222 | Tragic $58,214 |
| Tsimshian | 5.2 /100 | #223 | Tragic $58,202 |
| Bermudans | 5.1 /100 | #224 | Tragic $58,171 |
| Venezuelans | 4.4 /100 | #225 | Tragic $58,026 |
| French Canadians | 4.2 /100 | #226 | Tragic $57,975 |
| Japanese | 3.9 /100 | #227 | Tragic $57,919 |
| Immigrants | Albania | 3.6 /100 | #228 | Tragic $57,828 |
| Immigrants | Colombia | 3.0 /100 | #229 | Tragic $57,658 |
| Immigrants | Cambodia | 2.8 /100 | #230 | Tragic $57,580 |