Australian vs Tsimshian Median Earnings
COMPARE
Australian
Tsimshian
Median Earnings
Median Earnings Comparison
Australians
Tsimshian
$52,294
MEDIAN EARNINGS
100.0/ 100
METRIC RATING
47th/ 347
METRIC RANK
$43,695
MEDIAN EARNINGS
2.1/ 100
METRIC RATING
251st/ 347
METRIC RANK
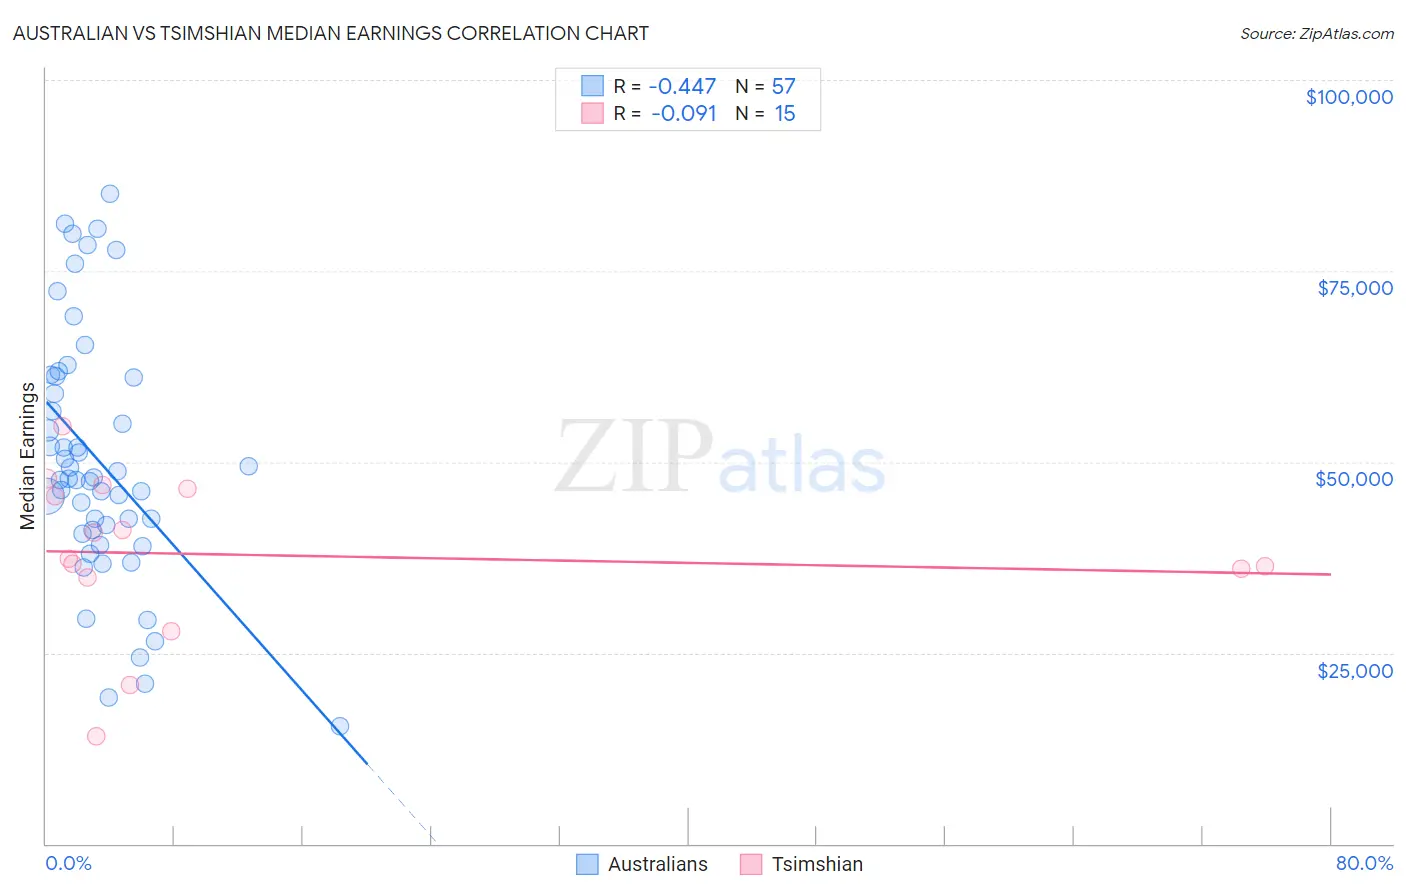
Australian vs Tsimshian Median Earnings Correlation Chart
The statistical analysis conducted on geographies consisting of 224,158,339 people shows a moderate negative correlation between the proportion of Australians and median earnings in the United States with a correlation coefficient (R) of -0.447 and weighted average of $52,294. Similarly, the statistical analysis conducted on geographies consisting of 15,626,544 people shows a slight negative correlation between the proportion of Tsimshian and median earnings in the United States with a correlation coefficient (R) of -0.091 and weighted average of $43,695, a difference of 19.7%.
Median Earnings Correlation Summary
| Measurement | Australian | Tsimshian |
| Minimum | $15,451 | $14,091 |
| Maximum | $85,069 | $54,691 |
| Range | $69,618 | $40,600 |
| Mean | $50,151 | $37,810 |
| Median | $47,849 | $37,241 |
| Interquartile 25% (IQ1) | $40,819 | $34,814 |
| Interquartile 75% (IQ3) | $61,206 | $46,528 |
| Interquartile Range (IQR) | $20,387 | $11,714 |
| Standard Deviation (Sample) | $16,224 | $10,670 |
| Standard Deviation (Population) | $16,081 | $10,309 |
Similar Demographics by Median Earnings
Demographics Similar to Australians by Median Earnings
In terms of median earnings, the demographic groups most similar to Australians are Bhutanese ($52,297, a difference of 0.010%), Immigrants from Czechoslovakia ($52,361, a difference of 0.13%), Immigrants from Europe ($52,195, a difference of 0.19%), Immigrants from Malaysia ($52,514, a difference of 0.42%), and Bulgarian ($52,512, a difference of 0.42%).
| Demographics | Rating | Rank | Median Earnings |
| Israelis | 100.0 /100 | #40 | Exceptional $52,937 |
| Immigrants | Lithuania | 100.0 /100 | #41 | Exceptional $52,769 |
| Maltese | 100.0 /100 | #42 | Exceptional $52,526 |
| Immigrants | Malaysia | 100.0 /100 | #43 | Exceptional $52,514 |
| Bulgarians | 100.0 /100 | #44 | Exceptional $52,512 |
| Immigrants | Czechoslovakia | 100.0 /100 | #45 | Exceptional $52,361 |
| Bhutanese | 100.0 /100 | #46 | Exceptional $52,297 |
| Australians | 100.0 /100 | #47 | Exceptional $52,294 |
| Immigrants | Europe | 100.0 /100 | #48 | Exceptional $52,195 |
| Bolivians | 100.0 /100 | #49 | Exceptional $52,005 |
| Immigrants | South Africa | 100.0 /100 | #50 | Exceptional $51,850 |
| Immigrants | Austria | 99.9 /100 | #51 | Exceptional $51,826 |
| Estonians | 99.9 /100 | #52 | Exceptional $51,772 |
| Immigrants | Norway | 99.9 /100 | #53 | Exceptional $51,758 |
| Immigrants | Indonesia | 99.9 /100 | #54 | Exceptional $51,715 |
Demographics Similar to Tsimshian by Median Earnings
In terms of median earnings, the demographic groups most similar to Tsimshian are Hawaiian ($43,673, a difference of 0.050%), Alaska Native ($43,750, a difference of 0.13%), Somali ($43,567, a difference of 0.30%), Malaysian ($43,844, a difference of 0.34%), and Liberian ($43,536, a difference of 0.37%).
| Demographics | Rating | Rank | Median Earnings |
| Immigrants | Nonimmigrants | 3.7 /100 | #244 | Tragic $44,117 |
| Immigrants | Burma/Myanmar | 3.2 /100 | #245 | Tragic $43,998 |
| Immigrants | West Indies | 3.1 /100 | #246 | Tragic $43,989 |
| Immigrants | Cabo Verde | 3.0 /100 | #247 | Tragic $43,963 |
| Nepalese | 2.6 /100 | #248 | Tragic $43,860 |
| Malaysians | 2.6 /100 | #249 | Tragic $43,844 |
| Alaska Natives | 2.3 /100 | #250 | Tragic $43,750 |
| Tsimshian | 2.1 /100 | #251 | Tragic $43,695 |
| Hawaiians | 2.0 /100 | #252 | Tragic $43,673 |
| Somalis | 1.8 /100 | #253 | Tragic $43,567 |
| Liberians | 1.7 /100 | #254 | Tragic $43,536 |
| Immigrants | Middle Africa | 1.4 /100 | #255 | Tragic $43,416 |
| Alaskan Athabascans | 1.4 /100 | #256 | Tragic $43,393 |
| Jamaicans | 1.3 /100 | #257 | Tragic $43,343 |
| French American Indians | 1.3 /100 | #258 | Tragic $43,333 |