Palestinian vs Tsimshian Median Earnings
COMPARE
Palestinian
Tsimshian
Median Earnings
Median Earnings Comparison
Palestinians
Tsimshian
$49,209
MEDIAN EARNINGS
98.0/ 100
METRIC RATING
108th/ 347
METRIC RANK
$43,695
MEDIAN EARNINGS
2.1/ 100
METRIC RATING
251st/ 347
METRIC RANK
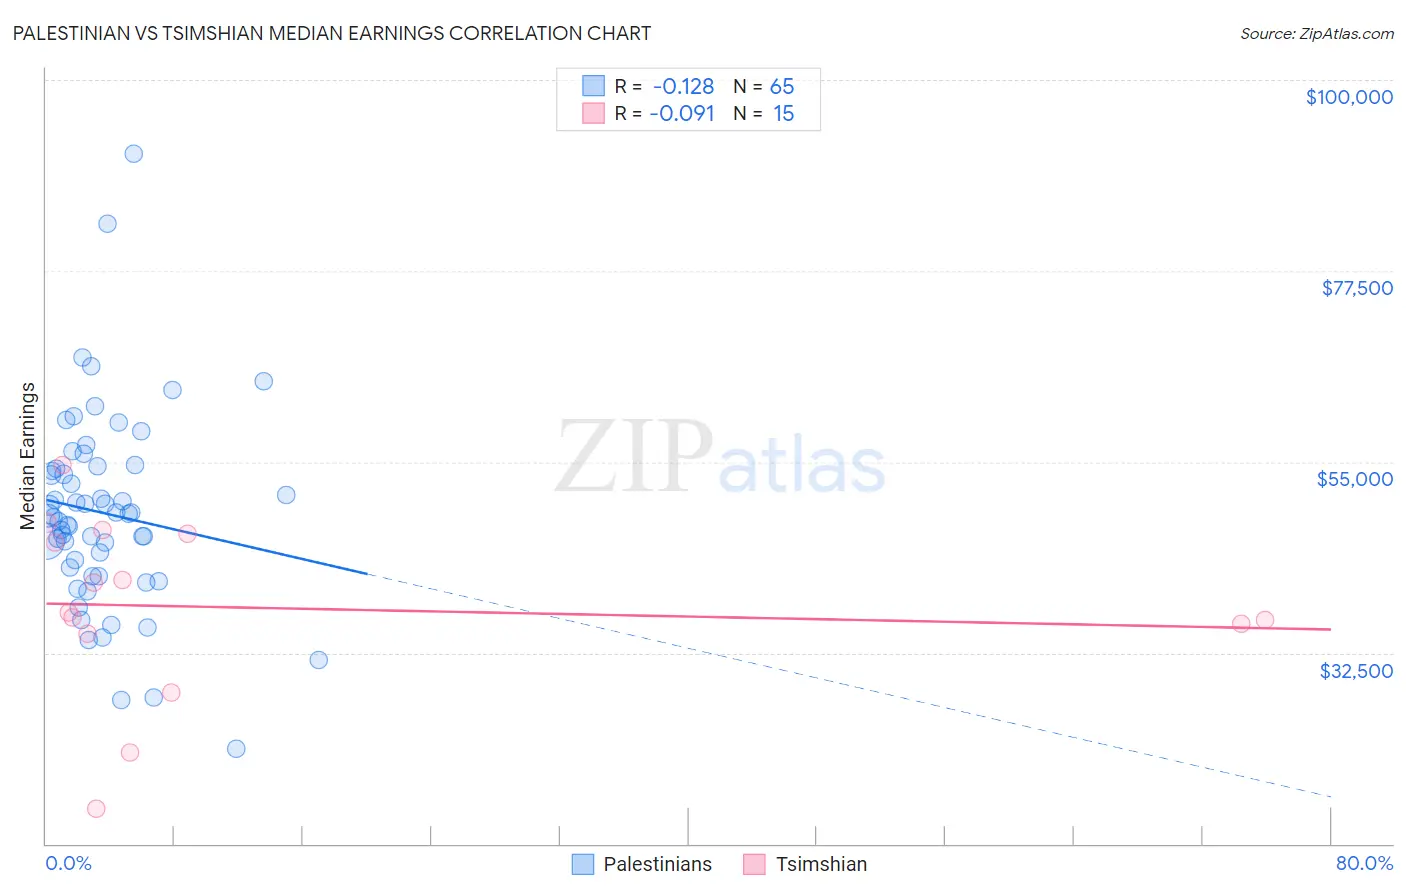
Palestinian vs Tsimshian Median Earnings Correlation Chart
The statistical analysis conducted on geographies consisting of 216,457,574 people shows a poor negative correlation between the proportion of Palestinians and median earnings in the United States with a correlation coefficient (R) of -0.128 and weighted average of $49,209. Similarly, the statistical analysis conducted on geographies consisting of 15,626,544 people shows a slight negative correlation between the proportion of Tsimshian and median earnings in the United States with a correlation coefficient (R) of -0.091 and weighted average of $43,695, a difference of 12.6%.
Median Earnings Correlation Summary
| Measurement | Palestinian | Tsimshian |
| Minimum | $21,204 | $14,091 |
| Maximum | $91,328 | $54,691 |
| Range | $70,124 | $40,600 |
| Mean | $48,950 | $37,810 |
| Median | $48,622 | $37,241 |
| Interquartile 25% (IQ1) | $42,020 | $34,814 |
| Interquartile 75% (IQ3) | $54,336 | $46,528 |
| Interquartile Range (IQR) | $12,316 | $11,714 |
| Standard Deviation (Sample) | $11,660 | $10,670 |
| Standard Deviation (Population) | $11,570 | $10,309 |
Similar Demographics by Median Earnings
Demographics Similar to Palestinians by Median Earnings
In terms of median earnings, the demographic groups most similar to Palestinians are Immigrants from Morocco ($49,368, a difference of 0.32%), Immigrants from Albania ($49,377, a difference of 0.34%), Immigrants from Western Asia ($49,389, a difference of 0.37%), Immigrants from Brazil ($49,463, a difference of 0.52%), and Syrian ($48,934, a difference of 0.56%).
| Demographics | Rating | Rank | Median Earnings |
| Jordanians | 98.9 /100 | #101 | Exceptional $49,632 |
| Ethiopians | 98.8 /100 | #102 | Exceptional $49,572 |
| Austrians | 98.7 /100 | #103 | Exceptional $49,501 |
| Immigrants | Brazil | 98.6 /100 | #104 | Exceptional $49,463 |
| Immigrants | Western Asia | 98.4 /100 | #105 | Exceptional $49,389 |
| Immigrants | Albania | 98.4 /100 | #106 | Exceptional $49,377 |
| Immigrants | Morocco | 98.4 /100 | #107 | Exceptional $49,368 |
| Palestinians | 98.0 /100 | #108 | Exceptional $49,209 |
| Syrians | 97.1 /100 | #109 | Exceptional $48,934 |
| Immigrants | Ethiopia | 97.1 /100 | #110 | Exceptional $48,924 |
| Immigrants | Zimbabwe | 97.0 /100 | #111 | Exceptional $48,913 |
| Northern Europeans | 96.9 /100 | #112 | Exceptional $48,887 |
| Immigrants | Kuwait | 96.8 /100 | #113 | Exceptional $48,861 |
| Moroccans | 96.7 /100 | #114 | Exceptional $48,838 |
| Chinese | 96.7 /100 | #115 | Exceptional $48,836 |
Demographics Similar to Tsimshian by Median Earnings
In terms of median earnings, the demographic groups most similar to Tsimshian are Hawaiian ($43,673, a difference of 0.050%), Alaska Native ($43,750, a difference of 0.13%), Somali ($43,567, a difference of 0.30%), Malaysian ($43,844, a difference of 0.34%), and Liberian ($43,536, a difference of 0.37%).
| Demographics | Rating | Rank | Median Earnings |
| Immigrants | Nonimmigrants | 3.7 /100 | #244 | Tragic $44,117 |
| Immigrants | Burma/Myanmar | 3.2 /100 | #245 | Tragic $43,998 |
| Immigrants | West Indies | 3.1 /100 | #246 | Tragic $43,989 |
| Immigrants | Cabo Verde | 3.0 /100 | #247 | Tragic $43,963 |
| Nepalese | 2.6 /100 | #248 | Tragic $43,860 |
| Malaysians | 2.6 /100 | #249 | Tragic $43,844 |
| Alaska Natives | 2.3 /100 | #250 | Tragic $43,750 |
| Tsimshian | 2.1 /100 | #251 | Tragic $43,695 |
| Hawaiians | 2.0 /100 | #252 | Tragic $43,673 |
| Somalis | 1.8 /100 | #253 | Tragic $43,567 |
| Liberians | 1.7 /100 | #254 | Tragic $43,536 |
| Immigrants | Middle Africa | 1.4 /100 | #255 | Tragic $43,416 |
| Alaskan Athabascans | 1.4 /100 | #256 | Tragic $43,393 |
| Jamaicans | 1.3 /100 | #257 | Tragic $43,343 |
| French American Indians | 1.3 /100 | #258 | Tragic $43,333 |