Afghan vs Potawatomi Householder Income Ages 45 - 64 years
COMPARE
Afghan
Potawatomi
Householder Income Ages 45 - 64 years
Householder Income Ages 45 - 64 years Comparison
Afghans
Potawatomi
$112,676
HOUSEHOLDER INCOME AGES 45 - 64 YEARS
99.8/ 100
METRIC RATING
53rd/ 347
METRIC RANK
$84,613
HOUSEHOLDER INCOME AGES 45 - 64 YEARS
0.0/ 100
METRIC RATING
301st/ 347
METRIC RANK
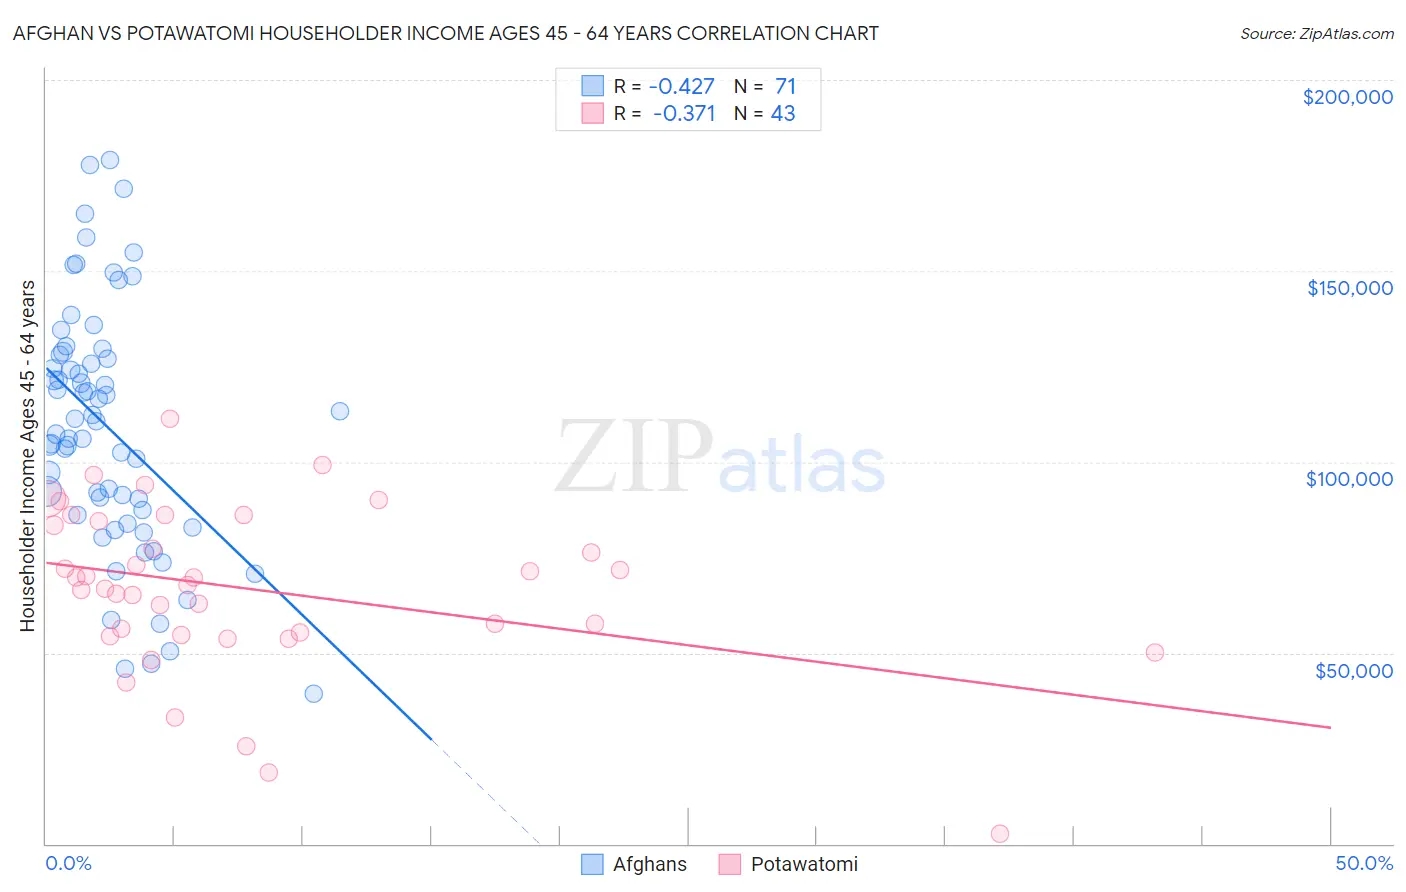
Afghan vs Potawatomi Householder Income Ages 45 - 64 years Correlation Chart
The statistical analysis conducted on geographies consisting of 148,795,333 people shows a moderate negative correlation between the proportion of Afghans and household income with householder between the ages 45 and 64 in the United States with a correlation coefficient (R) of -0.427 and weighted average of $112,676. Similarly, the statistical analysis conducted on geographies consisting of 117,696,566 people shows a mild negative correlation between the proportion of Potawatomi and household income with householder between the ages 45 and 64 in the United States with a correlation coefficient (R) of -0.371 and weighted average of $84,613, a difference of 33.2%.
Householder Income Ages 45 - 64 years Correlation Summary
| Measurement | Afghan | Potawatomi |
| Minimum | $39,280 | $2,499 |
| Maximum | $179,167 | $111,302 |
| Range | $139,887 | $108,803 |
| Mean | $108,848 | $66,726 |
| Median | $110,488 | $67,809 |
| Interquartile 25% (IQ1) | $85,959 | $54,506 |
| Interquartile 75% (IQ3) | $128,039 | $84,495 |
| Interquartile Range (IQR) | $42,080 | $29,989 |
| Standard Deviation (Sample) | $32,099 | $21,780 |
| Standard Deviation (Population) | $31,872 | $21,526 |
Similar Demographics by Householder Income Ages 45 - 64 years
Demographics Similar to Afghans by Householder Income Ages 45 - 64 years
In terms of householder income ages 45 - 64 years, the demographic groups most similar to Afghans are Greek ($112,630, a difference of 0.040%), Immigrants from Malaysia ($112,796, a difference of 0.11%), Lithuanian ($112,484, a difference of 0.17%), Immigrants from South Africa ($112,886, a difference of 0.19%), and Egyptian ($112,256, a difference of 0.37%).
| Demographics | Rating | Rank | Householder Income Ages 45 - 64 years |
| Immigrants | Greece | 99.9 /100 | #46 | Exceptional $113,548 |
| Australians | 99.9 /100 | #47 | Exceptional $113,533 |
| Immigrants | Indonesia | 99.9 /100 | #48 | Exceptional $113,519 |
| Immigrants | Russia | 99.8 /100 | #49 | Exceptional $113,215 |
| Immigrants | Austria | 99.8 /100 | #50 | Exceptional $113,140 |
| Immigrants | South Africa | 99.8 /100 | #51 | Exceptional $112,886 |
| Immigrants | Malaysia | 99.8 /100 | #52 | Exceptional $112,796 |
| Afghans | 99.8 /100 | #53 | Exceptional $112,676 |
| Greeks | 99.8 /100 | #54 | Exceptional $112,630 |
| Lithuanians | 99.8 /100 | #55 | Exceptional $112,484 |
| Egyptians | 99.7 /100 | #56 | Exceptional $112,256 |
| Immigrants | Scotland | 99.7 /100 | #57 | Exceptional $112,175 |
| Soviet Union | 99.7 /100 | #58 | Exceptional $112,008 |
| Immigrants | Europe | 99.7 /100 | #59 | Exceptional $111,984 |
| Immigrants | Netherlands | 99.7 /100 | #60 | Exceptional $111,982 |
Demographics Similar to Potawatomi by Householder Income Ages 45 - 64 years
In terms of householder income ages 45 - 64 years, the demographic groups most similar to Potawatomi are Haitian ($84,384, a difference of 0.27%), Indonesian ($84,890, a difference of 0.33%), Immigrants from Mexico ($84,910, a difference of 0.35%), African ($84,925, a difference of 0.37%), and Honduran ($84,079, a difference of 0.64%).
| Demographics | Rating | Rank | Householder Income Ages 45 - 64 years |
| British West Indians | 0.1 /100 | #294 | Tragic $85,571 |
| Immigrants | Grenada | 0.1 /100 | #295 | Tragic $85,552 |
| Immigrants | Zaire | 0.1 /100 | #296 | Tragic $85,207 |
| Fijians | 0.1 /100 | #297 | Tragic $85,187 |
| Africans | 0.0 /100 | #298 | Tragic $84,925 |
| Immigrants | Mexico | 0.0 /100 | #299 | Tragic $84,910 |
| Indonesians | 0.0 /100 | #300 | Tragic $84,890 |
| Potawatomi | 0.0 /100 | #301 | Tragic $84,613 |
| Haitians | 0.0 /100 | #302 | Tragic $84,384 |
| Hondurans | 0.0 /100 | #303 | Tragic $84,079 |
| Ottawa | 0.0 /100 | #304 | Tragic $83,953 |
| Chippewa | 0.0 /100 | #305 | Tragic $83,943 |
| Ute | 0.0 /100 | #306 | Tragic $83,937 |
| Shoshone | 0.0 /100 | #307 | Tragic $83,588 |
| Immigrants | Cabo Verde | 0.0 /100 | #308 | Tragic $83,542 |