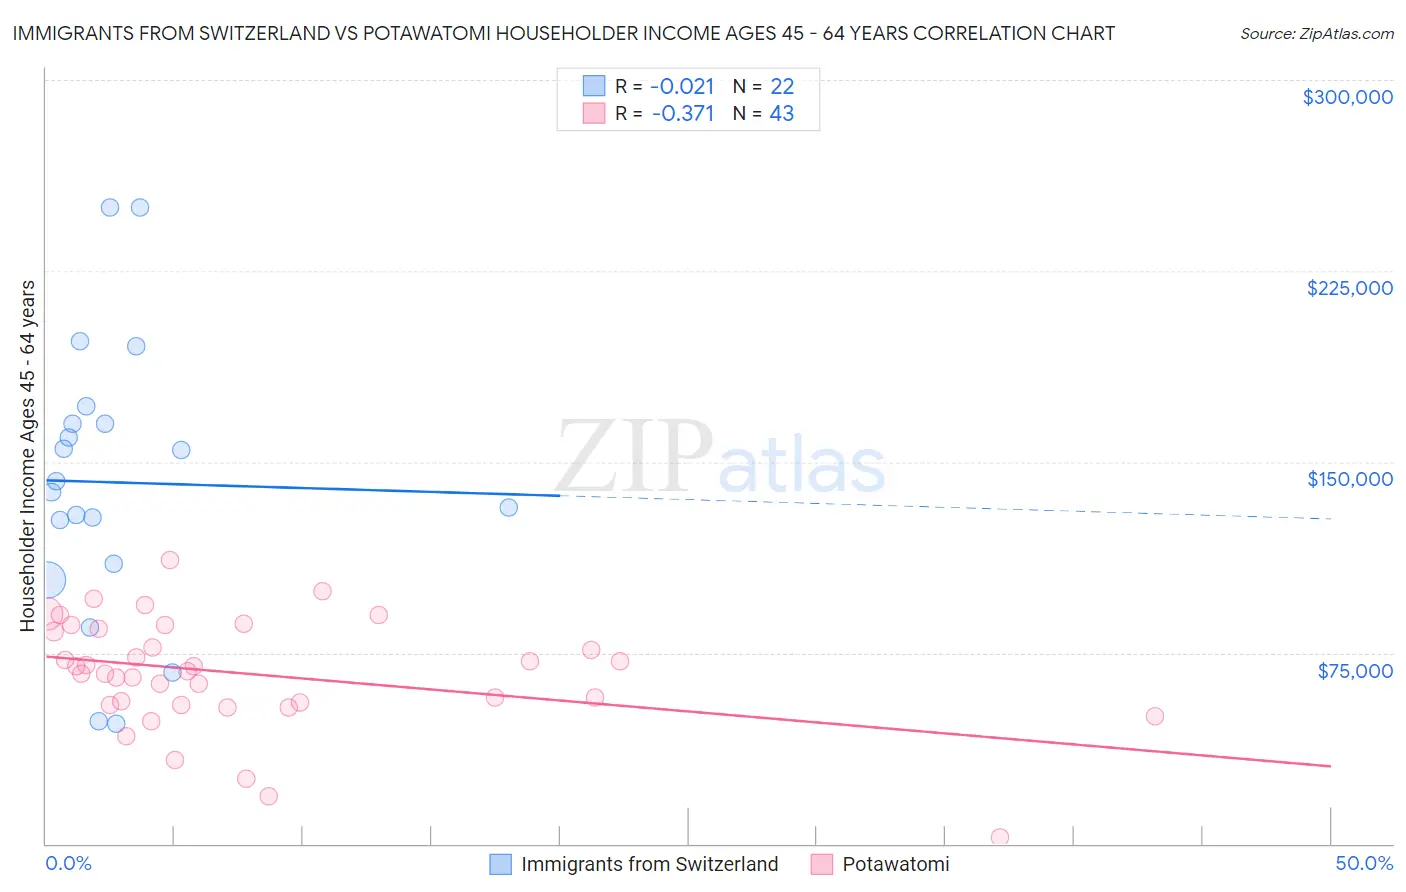
Immigrants from Switzerland vs Potawatomi Householder Income Ages 45 - 64 years
COMPARE
Immigrants from Switzerland
Potawatomi
Householder Income Ages 45 - 64 years
Householder Income Ages 45 - 64 years Comparison
Immigrants from Switzerland
Potawatomi
$115,934
HOUSEHOLDER INCOME AGES 45 - 64 YEARS
100.0/ 100
METRIC RATING
36th/ 347
METRIC RANK
$84,613
HOUSEHOLDER INCOME AGES 45 - 64 YEARS
0.0/ 100
METRIC RATING
301st/ 347
METRIC RANK
Immigrants from Switzerland vs Potawatomi Householder Income Ages 45 - 64 years Correlation Chart
The statistical analysis conducted on geographies consisting of 148,019,607 people shows no correlation between the proportion of Immigrants from Switzerland and household income with householder between the ages 45 and 64 in the United States with a correlation coefficient (R) of -0.021 and weighted average of $115,934. Similarly, the statistical analysis conducted on geographies consisting of 117,696,566 people shows a mild negative correlation between the proportion of Potawatomi and household income with householder between the ages 45 and 64 in the United States with a correlation coefficient (R) of -0.371 and weighted average of $84,613, a difference of 37.0%.
Householder Income Ages 45 - 64 years Correlation Summary
| Measurement | Immigrants from Switzerland | Potawatomi |
| Minimum | $47,188 | $2,499 |
| Maximum | $250,001 | $111,302 |
| Range | $202,813 | $108,803 |
| Mean | $141,958 | $66,726 |
| Median | $140,273 | $67,809 |
| Interquartile 25% (IQ1) | $109,782 | $54,506 |
| Interquartile 75% (IQ3) | $165,133 | $84,495 |
| Interquartile Range (IQR) | $55,351 | $29,989 |
| Standard Deviation (Sample) | $54,182 | $21,780 |
| Standard Deviation (Population) | $52,936 | $21,526 |
Similar Demographics by Householder Income Ages 45 - 64 years
Demographics Similar to Immigrants from Switzerland by Householder Income Ages 45 - 64 years
In terms of householder income ages 45 - 64 years, the demographic groups most similar to Immigrants from Switzerland are Latvian ($115,957, a difference of 0.020%), Immigrants from Denmark ($116,000, a difference of 0.060%), Chinese ($116,156, a difference of 0.19%), Russian ($116,328, a difference of 0.34%), and Immigrants from Asia ($116,566, a difference of 0.54%).
| Demographics | Rating | Rank | Householder Income Ages 45 - 64 years |
| Bhutanese | 100.0 /100 | #29 | Exceptional $117,750 |
| Immigrants | Bolivia | 100.0 /100 | #30 | Exceptional $117,731 |
| Immigrants | Asia | 100.0 /100 | #31 | Exceptional $116,566 |
| Russians | 100.0 /100 | #32 | Exceptional $116,328 |
| Chinese | 100.0 /100 | #33 | Exceptional $116,156 |
| Immigrants | Denmark | 100.0 /100 | #34 | Exceptional $116,000 |
| Latvians | 100.0 /100 | #35 | Exceptional $115,957 |
| Immigrants | Switzerland | 100.0 /100 | #36 | Exceptional $115,934 |
| Maltese | 99.9 /100 | #37 | Exceptional $114,754 |
| Immigrants | Pakistan | 99.9 /100 | #38 | Exceptional $114,434 |
| Immigrants | Turkey | 99.9 /100 | #39 | Exceptional $114,407 |
| Cambodians | 99.9 /100 | #40 | Exceptional $114,342 |
| Immigrants | Lithuania | 99.9 /100 | #41 | Exceptional $114,336 |
| Estonians | 99.9 /100 | #42 | Exceptional $114,220 |
| Israelis | 99.9 /100 | #43 | Exceptional $114,186 |
Demographics Similar to Potawatomi by Householder Income Ages 45 - 64 years
In terms of householder income ages 45 - 64 years, the demographic groups most similar to Potawatomi are Haitian ($84,384, a difference of 0.27%), Indonesian ($84,890, a difference of 0.33%), Immigrants from Mexico ($84,910, a difference of 0.35%), African ($84,925, a difference of 0.37%), and Honduran ($84,079, a difference of 0.64%).
| Demographics | Rating | Rank | Householder Income Ages 45 - 64 years |
| British West Indians | 0.1 /100 | #294 | Tragic $85,571 |
| Immigrants | Grenada | 0.1 /100 | #295 | Tragic $85,552 |
| Immigrants | Zaire | 0.1 /100 | #296 | Tragic $85,207 |
| Fijians | 0.1 /100 | #297 | Tragic $85,187 |
| Africans | 0.0 /100 | #298 | Tragic $84,925 |
| Immigrants | Mexico | 0.0 /100 | #299 | Tragic $84,910 |
| Indonesians | 0.0 /100 | #300 | Tragic $84,890 |
| Potawatomi | 0.0 /100 | #301 | Tragic $84,613 |
| Haitians | 0.0 /100 | #302 | Tragic $84,384 |
| Hondurans | 0.0 /100 | #303 | Tragic $84,079 |
| Ottawa | 0.0 /100 | #304 | Tragic $83,953 |
| Chippewa | 0.0 /100 | #305 | Tragic $83,943 |
| Ute | 0.0 /100 | #306 | Tragic $83,937 |
| Shoshone | 0.0 /100 | #307 | Tragic $83,588 |
| Immigrants | Cabo Verde | 0.0 /100 | #308 | Tragic $83,542 |