French vs Potawatomi Householder Income Ages 45 - 64 years
COMPARE
French
Potawatomi
Householder Income Ages 45 - 64 years
Householder Income Ages 45 - 64 years Comparison
French
Potawatomi
$99,824
HOUSEHOLDER INCOME AGES 45 - 64 YEARS
43.8/ 100
METRIC RATING
184th/ 347
METRIC RANK
$84,613
HOUSEHOLDER INCOME AGES 45 - 64 YEARS
0.0/ 100
METRIC RATING
301st/ 347
METRIC RANK
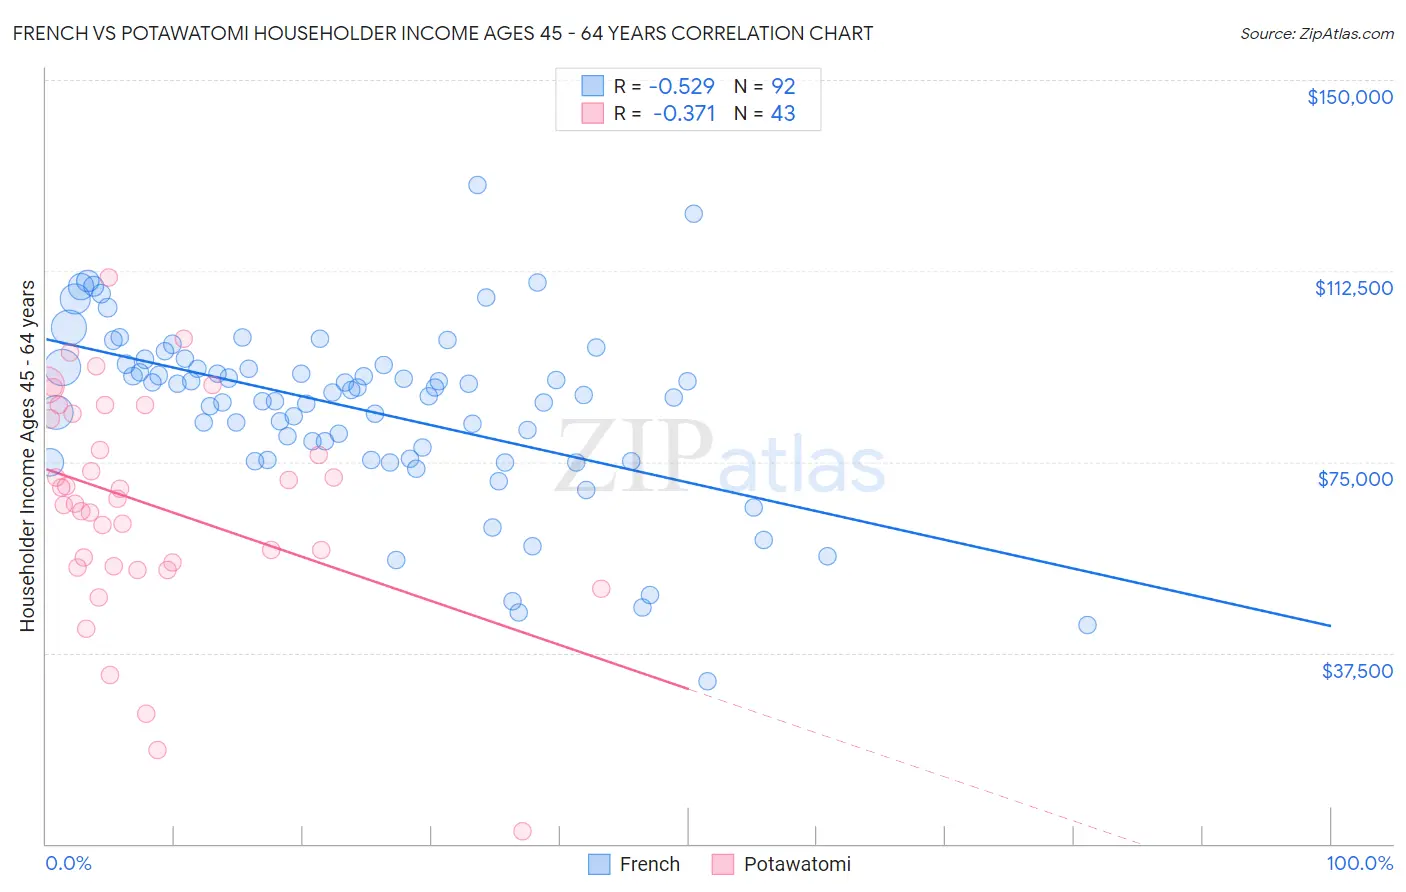
French vs Potawatomi Householder Income Ages 45 - 64 years Correlation Chart
The statistical analysis conducted on geographies consisting of 568,632,779 people shows a substantial negative correlation between the proportion of French and household income with householder between the ages 45 and 64 in the United States with a correlation coefficient (R) of -0.529 and weighted average of $99,824. Similarly, the statistical analysis conducted on geographies consisting of 117,696,566 people shows a mild negative correlation between the proportion of Potawatomi and household income with householder between the ages 45 and 64 in the United States with a correlation coefficient (R) of -0.371 and weighted average of $84,613, a difference of 18.0%.
Householder Income Ages 45 - 64 years Correlation Summary
| Measurement | French | Potawatomi |
| Minimum | $32,031 | $2,499 |
| Maximum | $129,396 | $111,302 |
| Range | $97,365 | $108,803 |
| Mean | $85,264 | $66,726 |
| Median | $88,490 | $67,809 |
| Interquartile 25% (IQ1) | $75,583 | $54,506 |
| Interquartile 75% (IQ3) | $93,777 | $84,495 |
| Interquartile Range (IQR) | $18,194 | $29,989 |
| Standard Deviation (Sample) | $17,163 | $21,780 |
| Standard Deviation (Population) | $17,070 | $21,526 |
Similar Demographics by Householder Income Ages 45 - 64 years
Demographics Similar to French by Householder Income Ages 45 - 64 years
In terms of householder income ages 45 - 64 years, the demographic groups most similar to French are Colombian ($99,772, a difference of 0.050%), Spaniard ($99,889, a difference of 0.070%), Finnish ($99,904, a difference of 0.080%), Immigrants ($99,943, a difference of 0.12%), and Dutch ($99,650, a difference of 0.17%).
| Demographics | Rating | Rank | Householder Income Ages 45 - 64 years |
| Moroccans | 47.7 /100 | #177 | Average $100,138 |
| Immigrants | Cameroon | 47.0 /100 | #178 | Average $100,084 |
| Belgians | 46.7 /100 | #179 | Average $100,060 |
| Aleuts | 46.6 /100 | #180 | Average $100,052 |
| Immigrants | Immigrants | 45.3 /100 | #181 | Average $99,943 |
| Finns | 44.8 /100 | #182 | Average $99,904 |
| Spaniards | 44.6 /100 | #183 | Average $99,889 |
| French | 43.8 /100 | #184 | Average $99,824 |
| Colombians | 43.2 /100 | #185 | Average $99,772 |
| Dutch | 41.7 /100 | #186 | Average $99,650 |
| Iraqis | 38.5 /100 | #187 | Fair $99,387 |
| Immigrants | Portugal | 36.3 /100 | #188 | Fair $99,203 |
| Immigrants | South America | 35.4 /100 | #189 | Fair $99,126 |
| French Canadians | 35.1 /100 | #190 | Fair $99,093 |
| Kenyans | 33.7 /100 | #191 | Fair $98,970 |
Demographics Similar to Potawatomi by Householder Income Ages 45 - 64 years
In terms of householder income ages 45 - 64 years, the demographic groups most similar to Potawatomi are Haitian ($84,384, a difference of 0.27%), Indonesian ($84,890, a difference of 0.33%), Immigrants from Mexico ($84,910, a difference of 0.35%), African ($84,925, a difference of 0.37%), and Honduran ($84,079, a difference of 0.64%).
| Demographics | Rating | Rank | Householder Income Ages 45 - 64 years |
| British West Indians | 0.1 /100 | #294 | Tragic $85,571 |
| Immigrants | Grenada | 0.1 /100 | #295 | Tragic $85,552 |
| Immigrants | Zaire | 0.1 /100 | #296 | Tragic $85,207 |
| Fijians | 0.1 /100 | #297 | Tragic $85,187 |
| Africans | 0.0 /100 | #298 | Tragic $84,925 |
| Immigrants | Mexico | 0.0 /100 | #299 | Tragic $84,910 |
| Indonesians | 0.0 /100 | #300 | Tragic $84,890 |
| Potawatomi | 0.0 /100 | #301 | Tragic $84,613 |
| Haitians | 0.0 /100 | #302 | Tragic $84,384 |
| Hondurans | 0.0 /100 | #303 | Tragic $84,079 |
| Ottawa | 0.0 /100 | #304 | Tragic $83,953 |
| Chippewa | 0.0 /100 | #305 | Tragic $83,943 |
| Ute | 0.0 /100 | #306 | Tragic $83,937 |
| Shoshone | 0.0 /100 | #307 | Tragic $83,588 |
| Immigrants | Cabo Verde | 0.0 /100 | #308 | Tragic $83,542 |