Trinidadian and Tobagonian vs Potawatomi Householder Income Ages 45 - 64 years
COMPARE
Trinidadian and Tobagonian
Potawatomi
Householder Income Ages 45 - 64 years
Householder Income Ages 45 - 64 years Comparison
Trinidadians and Tobagonians
Potawatomi
$91,357
HOUSEHOLDER INCOME AGES 45 - 64 YEARS
1.1/ 100
METRIC RATING
241st/ 347
METRIC RANK
$84,613
HOUSEHOLDER INCOME AGES 45 - 64 YEARS
0.0/ 100
METRIC RATING
301st/ 347
METRIC RANK
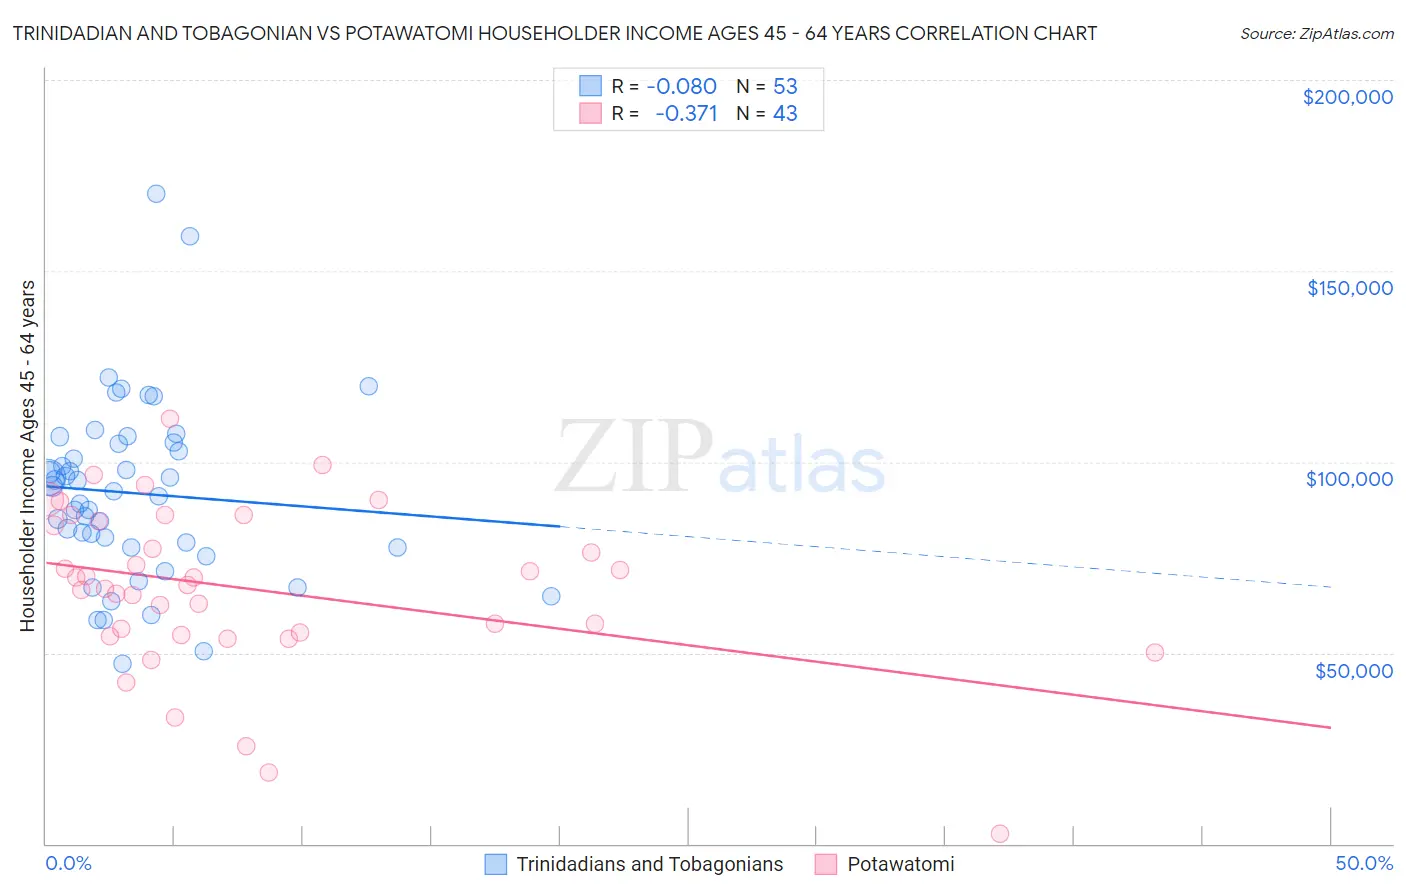
Trinidadian and Tobagonian vs Potawatomi Householder Income Ages 45 - 64 years Correlation Chart
The statistical analysis conducted on geographies consisting of 219,574,386 people shows a slight negative correlation between the proportion of Trinidadians and Tobagonians and household income with householder between the ages 45 and 64 in the United States with a correlation coefficient (R) of -0.080 and weighted average of $91,357. Similarly, the statistical analysis conducted on geographies consisting of 117,696,566 people shows a mild negative correlation between the proportion of Potawatomi and household income with householder between the ages 45 and 64 in the United States with a correlation coefficient (R) of -0.371 and weighted average of $84,613, a difference of 8.0%.
Householder Income Ages 45 - 64 years Correlation Summary
| Measurement | Trinidadian and Tobagonian | Potawatomi |
| Minimum | $47,269 | $2,499 |
| Maximum | $170,234 | $111,302 |
| Range | $122,965 | $108,803 |
| Mean | $91,778 | $66,726 |
| Median | $92,441 | $67,809 |
| Interquartile 25% (IQ1) | $77,664 | $54,506 |
| Interquartile 75% (IQ3) | $104,934 | $84,495 |
| Interquartile Range (IQR) | $27,270 | $29,989 |
| Standard Deviation (Sample) | $23,595 | $21,780 |
| Standard Deviation (Population) | $23,371 | $21,526 |
Similar Demographics by Householder Income Ages 45 - 64 years
Demographics Similar to Trinidadians and Tobagonians by Householder Income Ages 45 - 64 years
In terms of householder income ages 45 - 64 years, the demographic groups most similar to Trinidadians and Tobagonians are Inupiat ($91,355, a difference of 0.0%), Immigrants from Trinidad and Tobago ($91,347, a difference of 0.010%), Immigrants from Burma/Myanmar ($91,385, a difference of 0.030%), Immigrants from Middle Africa ($91,293, a difference of 0.070%), and Immigrants from Ecuador ($91,462, a difference of 0.12%).
| Demographics | Rating | Rank | Householder Income Ages 45 - 64 years |
| Immigrants | El Salvador | 2.7 /100 | #234 | Tragic $93,176 |
| Nicaraguans | 2.0 /100 | #235 | Tragic $92,554 |
| Immigrants | Western Africa | 1.8 /100 | #236 | Tragic $92,384 |
| Immigrants | Bangladesh | 1.7 /100 | #237 | Tragic $92,208 |
| Pennsylvania Germans | 1.5 /100 | #238 | Tragic $91,956 |
| Immigrants | Ecuador | 1.2 /100 | #239 | Tragic $91,462 |
| Immigrants | Burma/Myanmar | 1.1 /100 | #240 | Tragic $91,385 |
| Trinidadians and Tobagonians | 1.1 /100 | #241 | Tragic $91,357 |
| Inupiat | 1.1 /100 | #242 | Tragic $91,355 |
| Immigrants | Trinidad and Tobago | 1.1 /100 | #243 | Tragic $91,347 |
| Immigrants | Middle Africa | 1.1 /100 | #244 | Tragic $91,293 |
| Guyanese | 0.9 /100 | #245 | Tragic $90,966 |
| Central Americans | 0.9 /100 | #246 | Tragic $90,951 |
| Alaskan Athabascans | 0.9 /100 | #247 | Tragic $90,951 |
| Immigrants | Laos | 0.9 /100 | #248 | Tragic $90,909 |
Demographics Similar to Potawatomi by Householder Income Ages 45 - 64 years
In terms of householder income ages 45 - 64 years, the demographic groups most similar to Potawatomi are Haitian ($84,384, a difference of 0.27%), Indonesian ($84,890, a difference of 0.33%), Immigrants from Mexico ($84,910, a difference of 0.35%), African ($84,925, a difference of 0.37%), and Honduran ($84,079, a difference of 0.64%).
| Demographics | Rating | Rank | Householder Income Ages 45 - 64 years |
| British West Indians | 0.1 /100 | #294 | Tragic $85,571 |
| Immigrants | Grenada | 0.1 /100 | #295 | Tragic $85,552 |
| Immigrants | Zaire | 0.1 /100 | #296 | Tragic $85,207 |
| Fijians | 0.1 /100 | #297 | Tragic $85,187 |
| Africans | 0.0 /100 | #298 | Tragic $84,925 |
| Immigrants | Mexico | 0.0 /100 | #299 | Tragic $84,910 |
| Indonesians | 0.0 /100 | #300 | Tragic $84,890 |
| Potawatomi | 0.0 /100 | #301 | Tragic $84,613 |
| Haitians | 0.0 /100 | #302 | Tragic $84,384 |
| Hondurans | 0.0 /100 | #303 | Tragic $84,079 |
| Ottawa | 0.0 /100 | #304 | Tragic $83,953 |
| Chippewa | 0.0 /100 | #305 | Tragic $83,943 |
| Ute | 0.0 /100 | #306 | Tragic $83,937 |
| Shoshone | 0.0 /100 | #307 | Tragic $83,588 |
| Immigrants | Cabo Verde | 0.0 /100 | #308 | Tragic $83,542 |