Immigrants from Ghana vs Malaysian Currently Married
COMPARE
Immigrants from Ghana
Malaysian
Currently Married
Currently Married Comparison
Immigrants from Ghana
Malaysians
42.7%
CURRENTLY MARRIED
0.0/ 100
METRIC RATING
290th/ 347
METRIC RANK
45.9%
CURRENTLY MARRIED
15.3/ 100
METRIC RATING
201st/ 347
METRIC RANK
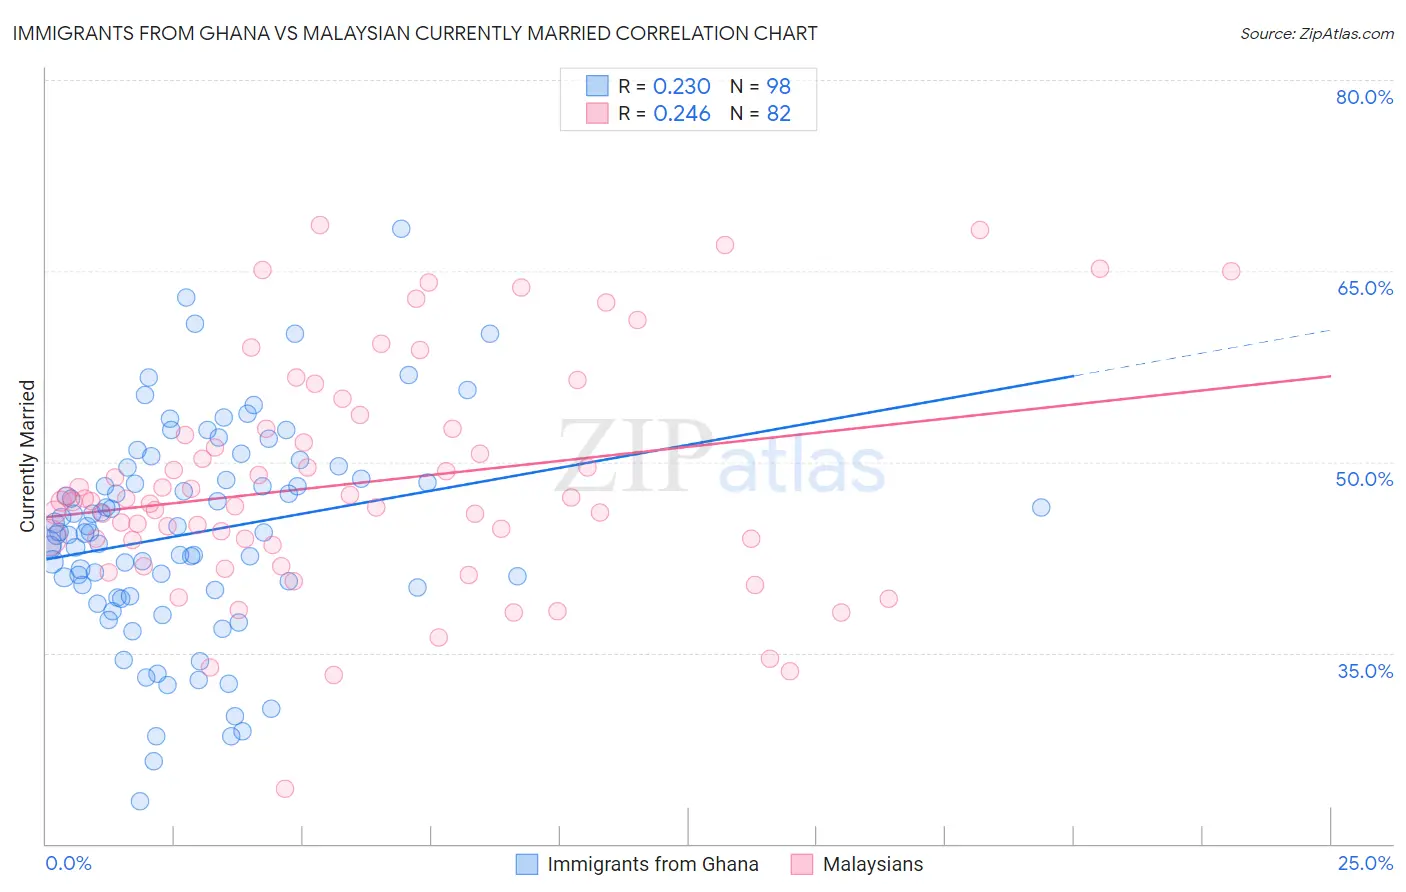
Immigrants from Ghana vs Malaysian Currently Married Correlation Chart
The statistical analysis conducted on geographies consisting of 199,931,543 people shows a weak positive correlation between the proportion of Immigrants from Ghana and percentage of population currently married in the United States with a correlation coefficient (R) of 0.230 and weighted average of 42.7%. Similarly, the statistical analysis conducted on geographies consisting of 226,093,582 people shows a weak positive correlation between the proportion of Malaysians and percentage of population currently married in the United States with a correlation coefficient (R) of 0.246 and weighted average of 45.9%, a difference of 7.5%.
Currently Married Correlation Summary
| Measurement | Immigrants from Ghana | Malaysian |
| Minimum | 23.3% | 24.3% |
| Maximum | 68.3% | 68.6% |
| Range | 45.0% | 44.3% |
| Mean | 44.4% | 48.3% |
| Median | 44.5% | 46.9% |
| Interquartile 25% (IQ1) | 39.9% | 43.9% |
| Interquartile 75% (IQ3) | 48.7% | 52.6% |
| Interquartile Range (IQR) | 8.8% | 8.7% |
| Standard Deviation (Sample) | 8.3% | 8.9% |
| Standard Deviation (Population) | 8.2% | 8.9% |
Similar Demographics by Currently Married
Demographics Similar to Immigrants from Ghana by Currently Married
In terms of currently married, the demographic groups most similar to Immigrants from Ghana are Paiute (42.7%, a difference of 0.010%), Immigrants from Guatemala (42.6%, a difference of 0.12%), Native/Alaskan (42.8%, a difference of 0.24%), Subsaharan African (42.6%, a difference of 0.27%), and Yuman (42.6%, a difference of 0.29%).
| Demographics | Rating | Rank | Currently Married |
| Kiowa | 0.0 /100 | #283 | Tragic 43.2% |
| Immigrants | El Salvador | 0.0 /100 | #284 | Tragic 43.1% |
| Immigrants | Middle Africa | 0.0 /100 | #285 | Tragic 43.0% |
| Ghanaians | 0.0 /100 | #286 | Tragic 42.9% |
| Guatemalans | 0.0 /100 | #287 | Tragic 42.9% |
| Natives/Alaskans | 0.0 /100 | #288 | Tragic 42.8% |
| Paiute | 0.0 /100 | #289 | Tragic 42.7% |
| Immigrants | Ghana | 0.0 /100 | #290 | Tragic 42.7% |
| Immigrants | Guatemala | 0.0 /100 | #291 | Tragic 42.6% |
| Sub-Saharan Africans | 0.0 /100 | #292 | Tragic 42.6% |
| Yuman | 0.0 /100 | #293 | Tragic 42.6% |
| Hondurans | 0.0 /100 | #294 | Tragic 42.5% |
| Immigrants | Western Africa | 0.0 /100 | #295 | Tragic 42.4% |
| Menominee | 0.0 /100 | #296 | Tragic 42.3% |
| Cheyenne | 0.0 /100 | #297 | Tragic 42.2% |
Demographics Similar to Malaysians by Currently Married
In terms of currently married, the demographic groups most similar to Malaysians are Immigrants from Albania (45.9%, a difference of 0.060%), Creek (46.0%, a difference of 0.13%), Immigrants from Costa Rica (46.0%, a difference of 0.27%), Taiwanese (45.8%, a difference of 0.29%), and Immigrants from Spain (45.8%, a difference of 0.30%).
| Demographics | Rating | Rank | Currently Married |
| South Americans | 23.8 /100 | #194 | Fair 46.1% |
| Immigrants | Nepal | 23.7 /100 | #195 | Fair 46.1% |
| Immigrants | Bosnia and Herzegovina | 22.2 /100 | #196 | Fair 46.1% |
| Immigrants | Kuwait | 21.7 /100 | #197 | Fair 46.1% |
| Immigrants | Colombia | 21.0 /100 | #198 | Fair 46.1% |
| Immigrants | Costa Rica | 19.6 /100 | #199 | Poor 46.0% |
| Creek | 17.2 /100 | #200 | Poor 46.0% |
| Malaysians | 15.3 /100 | #201 | Poor 45.9% |
| Immigrants | Albania | 14.5 /100 | #202 | Poor 45.9% |
| Taiwanese | 11.7 /100 | #203 | Poor 45.8% |
| Immigrants | Spain | 11.6 /100 | #204 | Poor 45.8% |
| South American Indians | 11.5 /100 | #205 | Poor 45.8% |
| Immigrants | Immigrants | 11.2 /100 | #206 | Poor 45.8% |
| Immigrants | South America | 10.8 /100 | #207 | Poor 45.7% |
| Alsatians | 10.8 /100 | #208 | Poor 45.7% |