Carpatho Rusyn vs Afghan Median Earnings
COMPARE
Carpatho Rusyn
Afghan
Median Earnings
Median Earnings Comparison
Carpatho Rusyns
Afghans
$48,617
MEDIAN EARNINGS
95.5/ 100
METRIC RATING
120th/ 347
METRIC RANK
$51,112
MEDIAN EARNINGS
99.9/ 100
METRIC RATING
66th/ 347
METRIC RANK
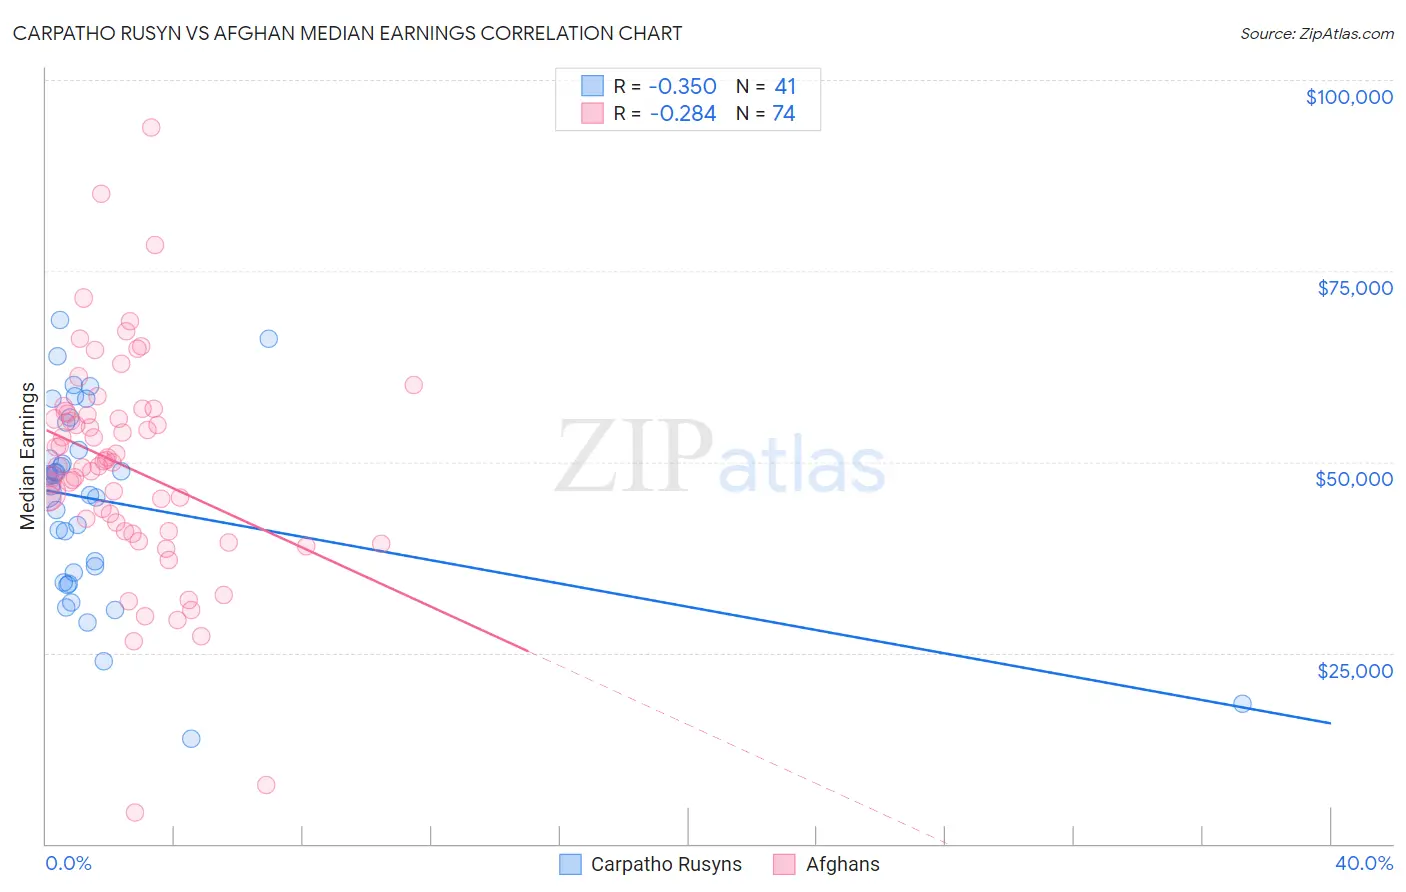
Carpatho Rusyn vs Afghan Median Earnings Correlation Chart
The statistical analysis conducted on geographies consisting of 58,866,831 people shows a mild negative correlation between the proportion of Carpatho Rusyns and median earnings in the United States with a correlation coefficient (R) of -0.350 and weighted average of $48,617. Similarly, the statistical analysis conducted on geographies consisting of 148,874,377 people shows a weak negative correlation between the proportion of Afghans and median earnings in the United States with a correlation coefficient (R) of -0.284 and weighted average of $51,112, a difference of 5.1%.
Median Earnings Correlation Summary
| Measurement | Carpatho Rusyn | Afghan |
| Minimum | $13,750 | $4,034 |
| Maximum | $68,541 | $93,750 |
| Range | $54,791 | $89,716 |
| Mean | $44,793 | $49,335 |
| Median | $46,820 | $49,670 |
| Interquartile 25% (IQ1) | $34,839 | $40,877 |
| Interquartile 75% (IQ3) | $53,317 | $56,283 |
| Interquartile Range (IQR) | $18,479 | $15,406 |
| Standard Deviation (Sample) | $12,606 | $14,513 |
| Standard Deviation (Population) | $12,452 | $14,415 |
Similar Demographics by Median Earnings
Demographics Similar to Carpatho Rusyns by Median Earnings
In terms of median earnings, the demographic groups most similar to Carpatho Rusyns are Arab ($48,599, a difference of 0.040%), Polish ($48,659, a difference of 0.080%), Immigrants from Jordan ($48,673, a difference of 0.11%), Serbian ($48,677, a difference of 0.12%), and Korean ($48,727, a difference of 0.23%).
| Demographics | Rating | Rank | Median Earnings |
| Immigrants | Kuwait | 96.8 /100 | #113 | Exceptional $48,861 |
| Moroccans | 96.7 /100 | #114 | Exceptional $48,838 |
| Chinese | 96.7 /100 | #115 | Exceptional $48,836 |
| Koreans | 96.2 /100 | #116 | Exceptional $48,727 |
| Serbians | 95.9 /100 | #117 | Exceptional $48,677 |
| Immigrants | Jordan | 95.9 /100 | #118 | Exceptional $48,673 |
| Poles | 95.8 /100 | #119 | Exceptional $48,659 |
| Carpatho Rusyns | 95.5 /100 | #120 | Exceptional $48,617 |
| Arabs | 95.4 /100 | #121 | Exceptional $48,599 |
| Chileans | 94.8 /100 | #122 | Exceptional $48,504 |
| Immigrants | Syria | 93.9 /100 | #123 | Exceptional $48,375 |
| Brazilians | 93.7 /100 | #124 | Exceptional $48,356 |
| Immigrants | Fiji | 93.3 /100 | #125 | Exceptional $48,305 |
| Assyrians/Chaldeans/Syriacs | 93.3 /100 | #126 | Exceptional $48,304 |
| Sierra Leoneans | 93.1 /100 | #127 | Exceptional $48,286 |
Demographics Similar to Afghans by Median Earnings
In terms of median earnings, the demographic groups most similar to Afghans are Immigrants from Spain ($51,092, a difference of 0.040%), Paraguayan ($51,068, a difference of 0.090%), Greek ($51,164, a difference of 0.10%), Mongolian ($51,038, a difference of 0.15%), and Lithuanian ($50,991, a difference of 0.24%).
| Demographics | Rating | Rank | Median Earnings |
| Immigrants | Croatia | 99.9 /100 | #59 | Exceptional $51,581 |
| Immigrants | Serbia | 99.9 /100 | #60 | Exceptional $51,557 |
| Immigrants | Latvia | 99.9 /100 | #61 | Exceptional $51,555 |
| Immigrants | Romania | 99.9 /100 | #62 | Exceptional $51,337 |
| Immigrants | Bulgaria | 99.9 /100 | #63 | Exceptional $51,318 |
| New Zealanders | 99.9 /100 | #64 | Exceptional $51,246 |
| Greeks | 99.9 /100 | #65 | Exceptional $51,164 |
| Afghans | 99.9 /100 | #66 | Exceptional $51,112 |
| Immigrants | Spain | 99.9 /100 | #67 | Exceptional $51,092 |
| Paraguayans | 99.9 /100 | #68 | Exceptional $51,068 |
| Mongolians | 99.8 /100 | #69 | Exceptional $51,038 |
| Lithuanians | 99.8 /100 | #70 | Exceptional $50,991 |
| Immigrants | Ukraine | 99.8 /100 | #71 | Exceptional $50,984 |
| Immigrants | Egypt | 99.8 /100 | #72 | Exceptional $50,901 |
| Immigrants | Netherlands | 99.8 /100 | #73 | Exceptional $50,818 |