Immigrants from England vs Laotian Median Female Earnings

COMPARE

Immigrants from England
Race
Ancestry
AfghanAfricanAlaska NativeAlaskan AthabascanAlbanianAleutAlsatianAmericanApacheArabArapahoArgentineanArmenianAssyrian/Chaldean/SyriacAustralianAustrianBahamianBangladeshiBarbadianBasqueBelgianBelizeanBermudanBhutaneseBlackfeetBolivianBrazilianBritishBritish West IndianBulgarianBurmeseCajunCambodianCanadianCape VerdeanCarpatho RusynCelticCentral AmericanCentral American IndianCherokeeCheyenneChickasawChileanChineseChippewaChoctawColombianColvilleComancheCosta RicanCreeCreekCroatianCrowCubanCypriotCzechCzechoslovakianDanishDelawareDominicanDutchDutch West IndianEastern EuropeanEcuadorianEgyptianEnglishEstonianEthiopianEuropeanFijianFilipinoFinnishFrenchFrench American IndianFrench CanadianGermanGerman RussianGhanaianGreekGuamanian/ChamorroGuatemalanGuyaneseHaitianHmongHonduranHopiHoumaHungarianIcelanderIndian (Asian)IndonesianInupiatIranianIraqiIrishIroquoisIsraeliItalianJamaicanJapaneseJordanianKenyanKiowaKoreanLatvianLebaneseLiberianLithuanianLumbeeLuxembourgerMacedonianMalaysianMalteseMarshalleseMenomineeMexicanMexican American IndianMongolianMoroccanNative HawaiianNavajoNepaleseNew ZealanderNicaraguanNigerianNorthern EuropeanNorwegianOkinawanOsageOttawaPaiutePakistaniPalestinianPanamanianParaguayanPennsylvania GermanPeruvianPimaPolishPortuguesePotawatomiPuebloPuerto RicanPuget Sound SalishRomanianRussianSalvadoranSamoanScandinavianScotch-IrishScottishSeminoleSenegaleseSerbianShoshoneSierra LeoneanSiouxSlavicSlovakSloveneSomaliSouth AfricanSouth AmericanSouth American IndianSoviet UnionSpaniardSpanishSpanish AmericanSpanish American IndianSri LankanSubsaharan AfricanSudaneseSwedishSwissSyrianTaiwaneseThaiTlingit-HaidaTohono O'OdhamTonganTrinidadian and TobagonianTsimshianTurkishU.S. Virgin IslanderUgandanUkrainianUruguayanUteVenezuelanVietnameseWelshWest IndianYakamaYaquiYugoslavianYumanYup'ikZimbabwean
Immigration
NonimmigrantsImmigrantsAfghanistanAfricaAlbaniaArgentinaArmeniaAsiaAustraliaAustriaBahamasBangladeshBarbadosBelarusBelgiumBelizeBoliviaBosnia and HerzegovinaBrazilBulgariaBurma/MyanmarCabo VerdeCambodiaCameroonCanadaCaribbeanCentral AmericaChileChinaColombiaCongoCosta RicaCroatiaCubaCzechoslovakiaDenmarkDominicaDominican RepublicEastern AfricaEastern AsiaEastern EuropeEcuadorEgyptEl SalvadorEnglandEritreaEthiopiaEuropeFijiFranceGermanyGhanaGreeceGrenadaGuatemalaGuyanaHaitiHondurasHong KongHungaryIndiaIndonesiaIranIraqIrelandIsraelItalyJamaicaJapanJordanKazakhstanKenyaKoreaKuwaitLaosLatin AmericaLatviaLebanonLiberiaLithuaniaMalaysiaMexicoMicronesiaMiddle AfricaMoldovaMoroccoNepalNetherlandsNicaraguaNigeriaNorth AmericaNorth MacedoniaNorthern AfricaNorthern EuropeNorwayOceaniaPakistanPanamaPeruPhilippinesPolandPortugalRomaniaRussiaSaudi ArabiaScotlandSenegalSerbiaSierra LeoneSingaporeSomaliaSouth AfricaSouth AmericaSouth Central AsiaSouth Eastern AsiaSouthern EuropeSpainSri LankaSt. Vincent and the GrenadinesSudanSwedenSwitzerlandSyriaTaiwanThailandTrinidad and TobagoTurkeyUgandaUkraineUruguayUzbekistanVenezuelaVietnamWest IndiesWestern AfricaWestern AsiaWestern EuropeYemenZaireZimbabweAzores
Laotian
Race
Ancestry
AfghanAfricanAlaska NativeAlaskan AthabascanAlbanianAleutAlsatianAmericanApacheArabArapahoArgentineanArmenianAssyrian/Chaldean/SyriacAustralianAustrianBahamianBangladeshiBarbadianBasqueBelgianBelizeanBermudanBhutaneseBlackfeetBolivianBrazilianBritishBritish West IndianBulgarianBurmeseCajunCambodianCanadianCape VerdeanCarpatho RusynCelticCentral AmericanCentral American IndianCherokeeCheyenneChickasawChileanChineseChippewaChoctawColombianColvilleComancheCosta RicanCreeCreekCroatianCrowCubanCypriotCzechCzechoslovakianDanishDelawareDominicanDutchDutch West IndianEastern EuropeanEcuadorianEgyptianEnglishEstonianEthiopianEuropeanFijianFilipinoFinnishFrenchFrench American IndianFrench CanadianGermanGerman RussianGhanaianGreekGuamanian/ChamorroGuatemalanGuyaneseHaitianHmongHonduranHopiHoumaHungarianIcelanderIndian (Asian)IndonesianInupiatIranianIraqiIrishIroquoisIsraeliItalianJamaicanJapaneseJordanianKenyanKiowaKoreanLaotianLatvianLebaneseLiberianLithuanianLumbeeLuxembourgerMacedonianMalaysianMalteseMarshalleseMenomineeMexicanMexican American IndianMongolianMoroccanNative HawaiianNavajoNepaleseNew ZealanderNicaraguanNigerianNorthern EuropeanNorwegianOkinawanOsageOttawaPaiutePakistaniPalestinianPanamanianParaguayanPennsylvania GermanPeruvianPimaPolishPortuguesePotawatomiPuebloPuerto RicanPuget Sound SalishRomanianRussianSalvadoranSamoanScandinavianScotch-IrishScottishSeminoleSenegaleseSerbianShoshoneSierra LeoneanSiouxSlavicSlovakSloveneSomaliSouth AfricanSouth AmericanSouth American IndianSoviet UnionSpaniardSpanishSpanish AmericanSpanish American IndianSri LankanSubsaharan AfricanSudaneseSwedishSwissSyrianTaiwaneseThaiTlingit-HaidaTohono O'OdhamTonganTrinidadian and TobagonianTsimshianTurkishU.S. Virgin IslanderUgandanUkrainianUruguayanUteVenezuelanVietnameseWelshWest IndianYakamaYaquiYugoslavianYumanYup'ikZimbabwean
Immigration
NonimmigrantsImmigrantsAfghanistanAfricaAlbaniaArgentinaArmeniaAsiaAustraliaAustriaBahamasBangladeshBarbadosBelarusBelgiumBelizeBoliviaBosnia and HerzegovinaBrazilBulgariaBurma/MyanmarCabo VerdeCambodiaCameroonCanadaCaribbeanCentral AmericaChileChinaColombiaCongoCosta RicaCroatiaCubaCzechoslovakiaDenmarkDominicaDominican RepublicEastern AfricaEastern AsiaEastern EuropeEcuadorEgyptEl SalvadorEritreaEthiopiaEuropeFijiFranceGermanyGhanaGreeceGrenadaGuatemalaGuyanaHaitiHondurasHong KongHungaryIndiaIndonesiaIranIraqIrelandIsraelItalyJamaicaJapanJordanKazakhstanKenyaKoreaKuwaitLaosLatin AmericaLatviaLebanonLiberiaLithuaniaMalaysiaMexicoMicronesiaMiddle AfricaMoldovaMoroccoNepalNetherlandsNicaraguaNigeriaNorth AmericaNorth MacedoniaNorthern AfricaNorthern EuropeNorwayOceaniaPakistanPanamaPeruPhilippinesPolandPortugalRomaniaRussiaSaudi ArabiaScotlandSenegalSerbiaSierra LeoneSingaporeSomaliaSouth AfricaSouth AmericaSouth Central AsiaSouth Eastern AsiaSouthern EuropeSpainSri LankaSt. Vincent and the GrenadinesSudanSwedenSwitzerlandSyriaTaiwanThailandTrinidad and TobagoTurkeyUgandaUkraineUruguayUzbekistanVenezuelaVietnamWest IndiesWestern AfricaWestern AsiaWestern EuropeYemenZaireZimbabweAzores
Median Female Earnings
Income
Poverty
Unemployment
Labor Participation
Family Structure
Vehicle Availability
Education Level
Disability

Median Female Earnings Comparison

Immigrants from England

Laotians

Exceptional
Exceptional
$41,277
MEDIAN FEMALE EARNINGS
96.4/ 100
METRIC RATING
114th/ 347
METRIC RANK
$42,133
MEDIAN FEMALE EARNINGS
99.4/ 100
METRIC RATING
85th/ 347
METRIC RANK

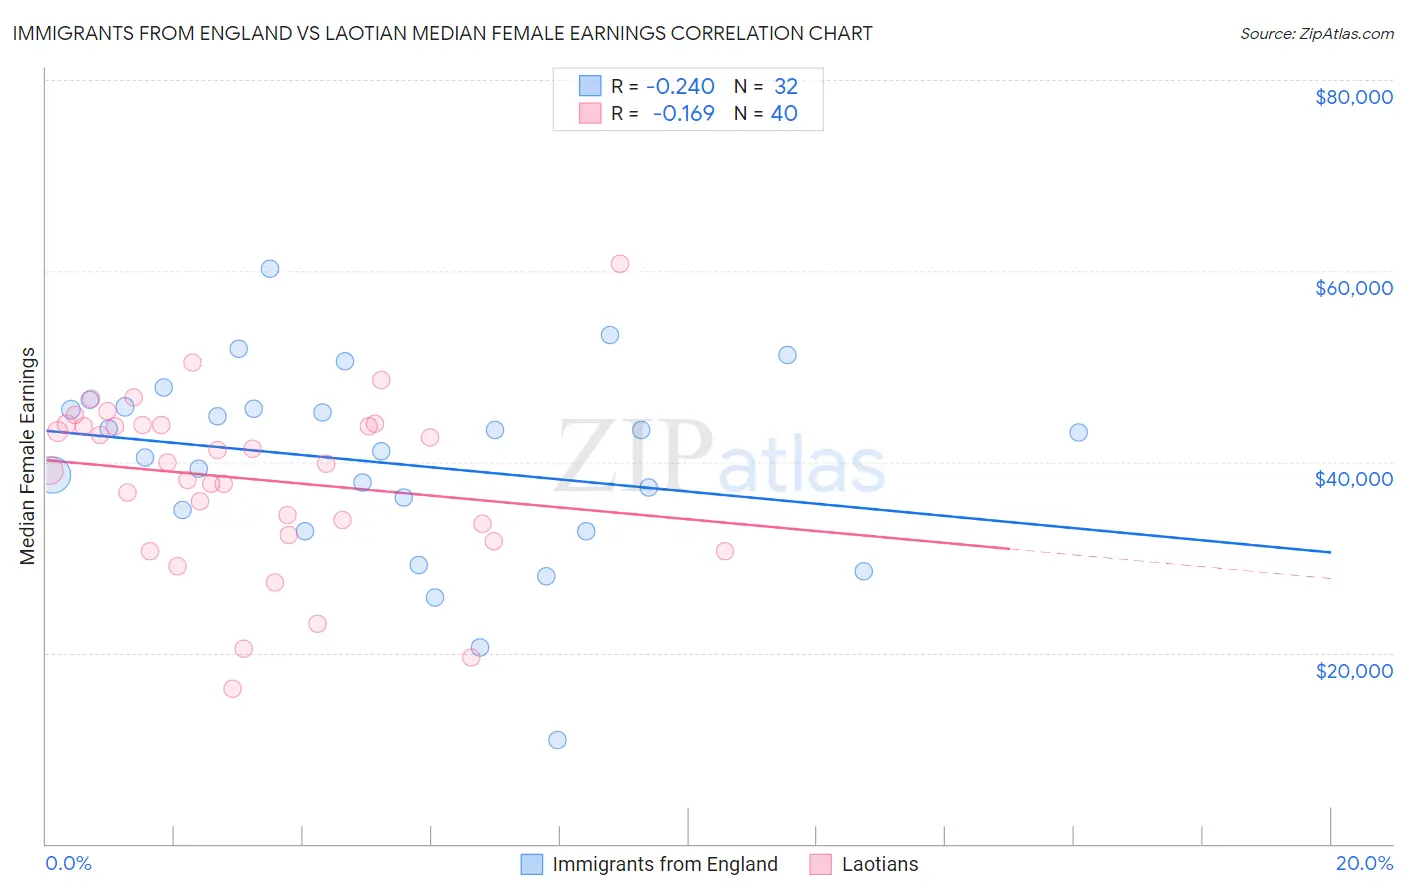
Immigrants from England vs Laotian Median Female Earnings Correlation Chart

The statistical analysis conducted on geographies consisting of 391,639,302 people shows a weak negative correlation between the proportion of Immigrants from England and median female earnings in the United States with a correlation coefficient (R) of -0.240 and weighted average of $41,277. Similarly, the statistical analysis conducted on geographies consisting of 224,815,855 people shows a poor negative correlation between the proportion of Laotians and median female earnings in the United States with a correlation coefficient (R) of -0.169 and weighted average of $42,133, a difference of 2.1%.
Immigrants from England vs Laotian Median Female Earnings

Median Female Earnings Correlation Summary

MeasurementImmigrants from EnglandLaotian
Minimum$10,833$16,291
Maximum$60,183$60,722
Range$49,350$44,431
Mean$39,877$38,224
Median$42,129$39,876
Interquartile 25% (IQ1)$33,842$32,877
Interquartile 75% (IQ3)$45,694$43,879
Interquartile Range (IQR)$11,853$11,002
Standard Deviation (Sample)$10,217$8,986
Standard Deviation (Population)$10,056$8,873

Similar Demographics by Median Female Earnings

Demographics Similar to Immigrants from England by Median Female Earnings

In terms of median female earnings, the demographic groups most similar to Immigrants from England are Korean ($41,276, a difference of 0.0%), Immigrants from Brazil ($41,273, a difference of 0.010%), Macedonian ($41,286, a difference of 0.020%), Barbadian ($41,261, a difference of 0.040%), and Immigrants from North America ($41,319, a difference of 0.10%).
DemographicsRating | RankMedian Female Earnings
Palestinians
97.6
/100
|
#107
Exceptional
$41,484
Jordanians
97.5
/100
|
#108
Exceptional
$41,464
Chinese
97.5
/100
|
#109
Exceptional
$41,461
Immigrants | Western Asia
97.0
/100
|
#110
Exceptional
$41,375
Immigrants | Canada
97.0
/100
|
#111
Exceptional
$41,373
Immigrants | North America
96.7
/100
|
#112
Exceptional
$41,319
Macedonians
96.4
/100
|
#113
Exceptional
$41,286
Immigrants | England
96.4
/100
|
#114
Exceptional
$41,277
Koreans
96.4
/100
|
#115
Exceptional
$41,276
Immigrants | Brazil
96.4
/100
|
#116
Exceptional
$41,273
Barbadians
96.3
/100
|
#117
Exceptional
$41,261
Immigrants | Lebanon
95.6
/100
|
#118
Exceptional
$41,183
Immigrants | Philippines
95.0
/100
|
#119
Exceptional
$41,114
Immigrants | Kuwait
94.4
/100
|
#120
Exceptional
$41,055
Croatians
93.7
/100
|
#121
Exceptional
$40,993

Demographics Similar to Laotians by Median Female Earnings

In terms of median female earnings, the demographic groups most similar to Laotians are Immigrants from St. Vincent and the Grenadines ($42,108, a difference of 0.060%), Lithuanian ($42,108, a difference of 0.060%), Immigrants from Northern Africa ($42,084, a difference of 0.12%), Immigrants from Afghanistan ($42,055, a difference of 0.18%), and Immigrants from Sierra Leone ($42,214, a difference of 0.19%).
DemographicsRating | RankMedian Female Earnings
Immigrants | Kazakhstan
99.6
/100
|
#78
Exceptional
$42,386
Greeks
99.6
/100
|
#79
Exceptional
$42,336
Immigrants | Moldova
99.6
/100
|
#80
Exceptional
$42,304
Immigrants | Southern Europe
99.5
/100
|
#81
Exceptional
$42,275
Immigrants | Morocco
99.5
/100
|
#82
Exceptional
$42,229
Immigrants | Sierra Leone
99.5
/100
|
#83
Exceptional
$42,214
Armenians
99.5
/100
|
#84
Exceptional
$42,212
Laotians
99.4
/100
|
#85
Exceptional
$42,133
Immigrants | St. Vincent and the Grenadines
99.3
/100
|
#86
Exceptional
$42,108
Lithuanians
99.3
/100
|
#87
Exceptional
$42,108
Immigrants | Northern Africa
99.3
/100
|
#88
Exceptional
$42,084
Immigrants | Afghanistan
99.3
/100
|
#89
Exceptional
$42,055
Ukrainians
99.2
/100
|
#90
Exceptional
$42,015
Immigrants | Western Europe
99.2
/100
|
#91
Exceptional
$41,990
Argentineans
99.1
/100
|
#92
Exceptional
$41,952