Immigrants from England vs Moroccan Median Female Earnings
COMPARE
Immigrants from England
Moroccan
Median Female Earnings
Median Female Earnings Comparison
Immigrants from England
Moroccans
$41,277
MEDIAN FEMALE EARNINGS
96.4/ 100
METRIC RATING
114th/ 347
METRIC RANK
$41,872
MEDIAN FEMALE EARNINGS
98.9/ 100
METRIC RATING
94th/ 347
METRIC RANK
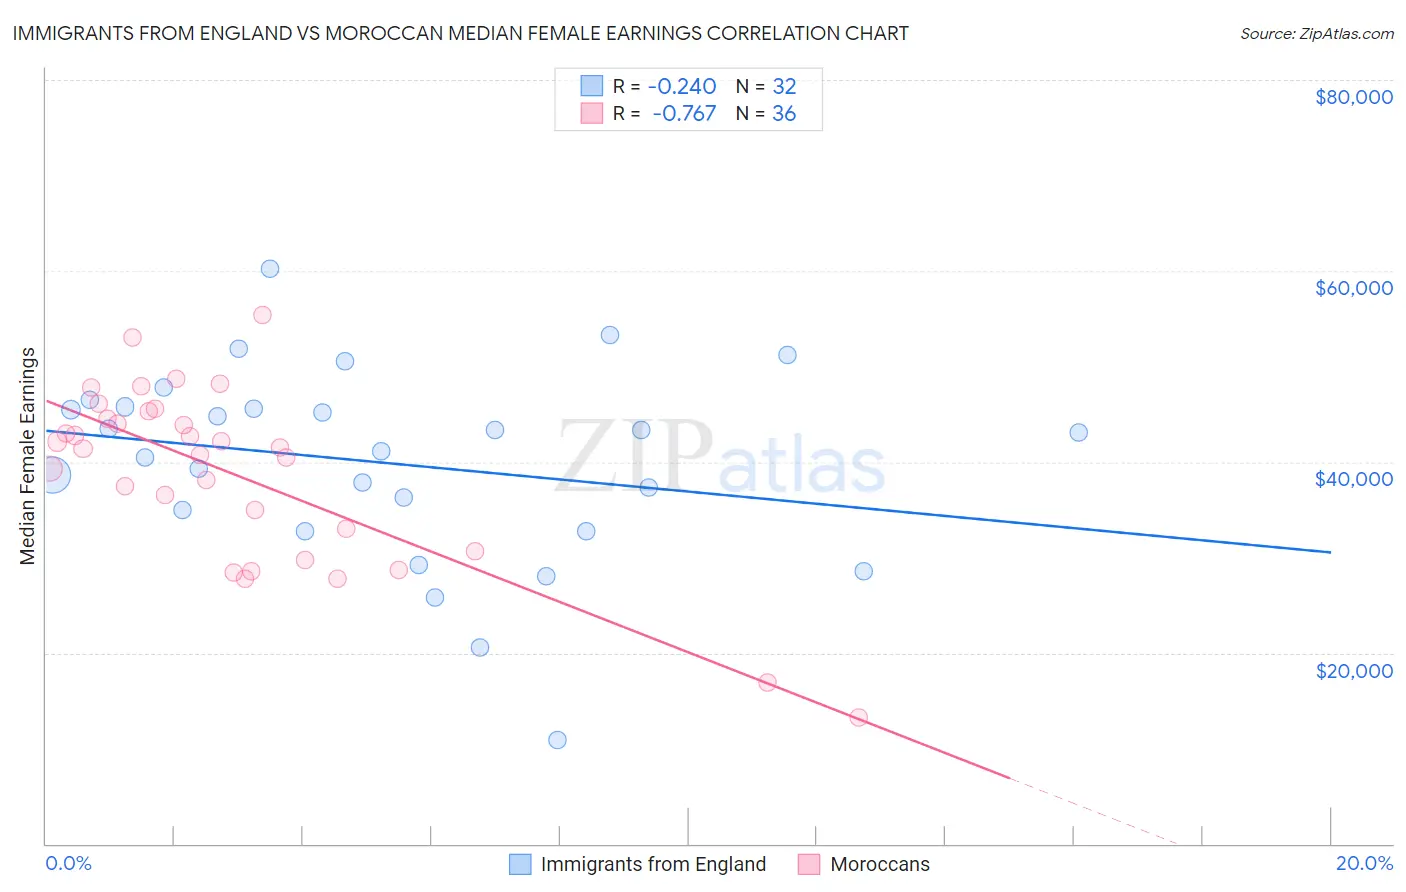
Immigrants from England vs Moroccan Median Female Earnings Correlation Chart
The statistical analysis conducted on geographies consisting of 391,639,302 people shows a weak negative correlation between the proportion of Immigrants from England and median female earnings in the United States with a correlation coefficient (R) of -0.240 and weighted average of $41,277. Similarly, the statistical analysis conducted on geographies consisting of 201,786,783 people shows a strong negative correlation between the proportion of Moroccans and median female earnings in the United States with a correlation coefficient (R) of -0.767 and weighted average of $41,872, a difference of 1.4%.
Median Female Earnings Correlation Summary
| Measurement | Immigrants from England | Moroccan |
| Minimum | $10,833 | $13,173 |
| Maximum | $60,183 | $55,417 |
| Range | $49,350 | $42,244 |
| Mean | $39,877 | $38,834 |
| Median | $42,129 | $41,478 |
| Interquartile 25% (IQ1) | $33,842 | $31,827 |
| Interquartile 75% (IQ3) | $45,694 | $44,890 |
| Interquartile Range (IQR) | $11,853 | $13,063 |
| Standard Deviation (Sample) | $10,217 | $9,328 |
| Standard Deviation (Population) | $10,056 | $9,197 |
Demographics Similar to Immigrants from England and Moroccans by Median Female Earnings
In terms of median female earnings, the demographic groups most similar to Immigrants from England are Macedonian ($41,286, a difference of 0.020%), Immigrants from North America ($41,319, a difference of 0.10%), Immigrants from Canada ($41,373, a difference of 0.23%), Immigrants from Western Asia ($41,375, a difference of 0.24%), and Chinese ($41,461, a difference of 0.45%). Similarly, the demographic groups most similar to Moroccans are Immigrants from Netherlands ($41,870, a difference of 0.0%), South African ($41,825, a difference of 0.11%), Immigrants from Hungary ($41,820, a difference of 0.12%), Immigrants from Scotland ($41,771, a difference of 0.24%), and Immigrants from Barbados ($41,685, a difference of 0.45%).
| Demographics | Rating | Rank | Median Female Earnings |
| Moroccans | 98.9 /100 | #94 | Exceptional $41,872 |
| Immigrants | Netherlands | 98.9 /100 | #95 | Exceptional $41,870 |
| South Africans | 98.8 /100 | #96 | Exceptional $41,825 |
| Immigrants | Hungary | 98.8 /100 | #97 | Exceptional $41,820 |
| Immigrants | Scotland | 98.7 /100 | #98 | Exceptional $41,771 |
| Immigrants | Barbados | 98.4 /100 | #99 | Exceptional $41,685 |
| Romanians | 98.3 /100 | #100 | Exceptional $41,663 |
| Immigrants | Fiji | 98.3 /100 | #101 | Exceptional $41,656 |
| Immigrants | Poland | 98.2 /100 | #102 | Exceptional $41,630 |
| Immigrants | Argentina | 97.9 /100 | #103 | Exceptional $41,554 |
| Immigrants | Zimbabwe | 97.8 /100 | #104 | Exceptional $41,527 |
| Italians | 97.7 /100 | #105 | Exceptional $41,505 |
| Immigrants | Eritrea | 97.6 /100 | #106 | Exceptional $41,485 |
| Palestinians | 97.6 /100 | #107 | Exceptional $41,484 |
| Jordanians | 97.5 /100 | #108 | Exceptional $41,464 |
| Chinese | 97.5 /100 | #109 | Exceptional $41,461 |
| Immigrants | Western Asia | 97.0 /100 | #110 | Exceptional $41,375 |
| Immigrants | Canada | 97.0 /100 | #111 | Exceptional $41,373 |
| Immigrants | North America | 96.7 /100 | #112 | Exceptional $41,319 |
| Macedonians | 96.4 /100 | #113 | Exceptional $41,286 |
| Immigrants | England | 96.4 /100 | #114 | Exceptional $41,277 |