Immigrants from Eastern Asia vs Peruvian Median Earnings
COMPARE
Immigrants from Eastern Asia
Peruvian
Median Earnings
Median Earnings Comparison
Immigrants from Eastern Asia
Peruvians
$56,183
MEDIAN EARNINGS
100.0/ 100
METRIC RATING
16th/ 347
METRIC RANK
$47,628
MEDIAN EARNINGS
84.2/ 100
METRIC RATING
150th/ 347
METRIC RANK
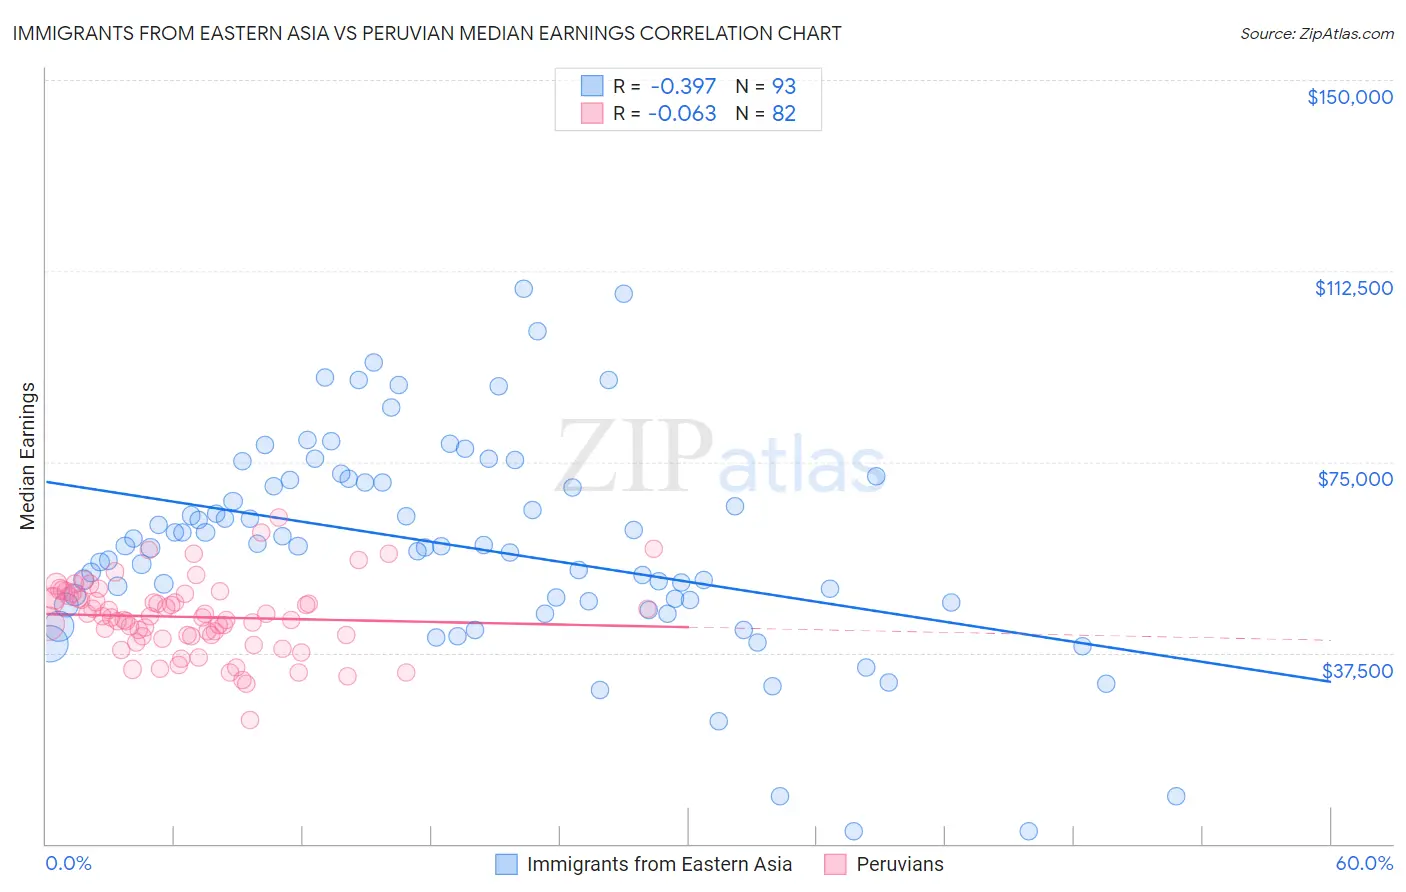
Immigrants from Eastern Asia vs Peruvian Median Earnings Correlation Chart
The statistical analysis conducted on geographies consisting of 499,910,866 people shows a mild negative correlation between the proportion of Immigrants from Eastern Asia and median earnings in the United States with a correlation coefficient (R) of -0.397 and weighted average of $56,183. Similarly, the statistical analysis conducted on geographies consisting of 363,247,580 people shows a slight negative correlation between the proportion of Peruvians and median earnings in the United States with a correlation coefficient (R) of -0.063 and weighted average of $47,628, a difference of 18.0%.
Median Earnings Correlation Summary
| Measurement | Immigrants from Eastern Asia | Peruvian |
| Minimum | $2,499 | $24,212 |
| Maximum | $109,069 | $64,091 |
| Range | $106,570 | $39,879 |
| Mean | $58,494 | $44,547 |
| Median | $58,436 | $44,525 |
| Interquartile 25% (IQ1) | $47,510 | $40,828 |
| Interquartile 75% (IQ3) | $71,190 | $48,604 |
| Interquartile Range (IQR) | $23,680 | $7,775 |
| Standard Deviation (Sample) | $20,635 | $7,153 |
| Standard Deviation (Population) | $20,524 | $7,110 |
Similar Demographics by Median Earnings
Demographics Similar to Immigrants from Eastern Asia by Median Earnings
In terms of median earnings, the demographic groups most similar to Immigrants from Eastern Asia are Indian (Asian) ($56,253, a difference of 0.12%), Immigrants from Australia ($56,305, a difference of 0.22%), Immigrants from China ($56,638, a difference of 0.81%), Immigrants from Ireland ($56,854, a difference of 1.2%), and Immigrants from Israel ($57,034, a difference of 1.5%).
| Demographics | Rating | Rank | Median Earnings |
| Okinawans | 100.0 /100 | #9 | Exceptional $57,550 |
| Immigrants | South Central Asia | 100.0 /100 | #10 | Exceptional $57,114 |
| Immigrants | Israel | 100.0 /100 | #11 | Exceptional $57,034 |
| Immigrants | Ireland | 100.0 /100 | #12 | Exceptional $56,854 |
| Immigrants | China | 100.0 /100 | #13 | Exceptional $56,638 |
| Immigrants | Australia | 100.0 /100 | #14 | Exceptional $56,305 |
| Indians (Asian) | 100.0 /100 | #15 | Exceptional $56,253 |
| Immigrants | Eastern Asia | 100.0 /100 | #16 | Exceptional $56,183 |
| Eastern Europeans | 100.0 /100 | #17 | Exceptional $55,084 |
| Immigrants | Japan | 100.0 /100 | #18 | Exceptional $54,938 |
| Immigrants | Belgium | 100.0 /100 | #19 | Exceptional $54,679 |
| Cypriots | 100.0 /100 | #20 | Exceptional $54,589 |
| Burmese | 100.0 /100 | #21 | Exceptional $54,559 |
| Immigrants | Korea | 100.0 /100 | #22 | Exceptional $54,530 |
| Immigrants | Sweden | 100.0 /100 | #23 | Exceptional $54,478 |
Demographics Similar to Peruvians by Median Earnings
In terms of median earnings, the demographic groups most similar to Peruvians are Luxembourger ($47,640, a difference of 0.020%), Immigrants from Oceania ($47,617, a difference of 0.020%), Immigrants from Eritrea ($47,657, a difference of 0.060%), Immigrants from South Eastern Asia ($47,671, a difference of 0.090%), and Immigrants from Germany ($47,566, a difference of 0.13%).
| Demographics | Rating | Rank | Median Earnings |
| Swedes | 88.0 /100 | #143 | Excellent $47,851 |
| Hungarians | 87.1 /100 | #144 | Excellent $47,795 |
| Immigrants | Saudi Arabia | 85.6 /100 | #145 | Excellent $47,704 |
| Immigrants | Chile | 85.5 /100 | #146 | Excellent $47,697 |
| Immigrants | South Eastern Asia | 85.0 /100 | #147 | Excellent $47,671 |
| Immigrants | Eritrea | 84.8 /100 | #148 | Excellent $47,657 |
| Luxembourgers | 84.5 /100 | #149 | Excellent $47,640 |
| Peruvians | 84.2 /100 | #150 | Excellent $47,628 |
| Immigrants | Oceania | 84.1 /100 | #151 | Excellent $47,617 |
| Immigrants | Germany | 83.1 /100 | #152 | Excellent $47,566 |
| Slavs | 81.1 /100 | #153 | Excellent $47,470 |
| Immigrants | Portugal | 77.3 /100 | #154 | Good $47,304 |
| Immigrants | Vietnam | 76.7 /100 | #155 | Good $47,282 |
| Irish | 76.6 /100 | #156 | Good $47,276 |
| Czechs | 75.1 /100 | #157 | Good $47,221 |