Immigrants from Eastern Asia vs Alaska Native In Labor Force | Age 30-34
COMPARE
Immigrants from Eastern Asia
Alaska Native
In Labor Force | Age 30-34
In Labor Force | Age 30-34 Comparison
Immigrants from Eastern Asia
Alaska Natives
85.4%
IN LABOR FORCE | AGE 30-34
98.9/ 100
METRIC RATING
77th/ 347
METRIC RANK
81.3%
IN LABOR FORCE | AGE 30-34
0.0/ 100
METRIC RATING
321st/ 347
METRIC RANK
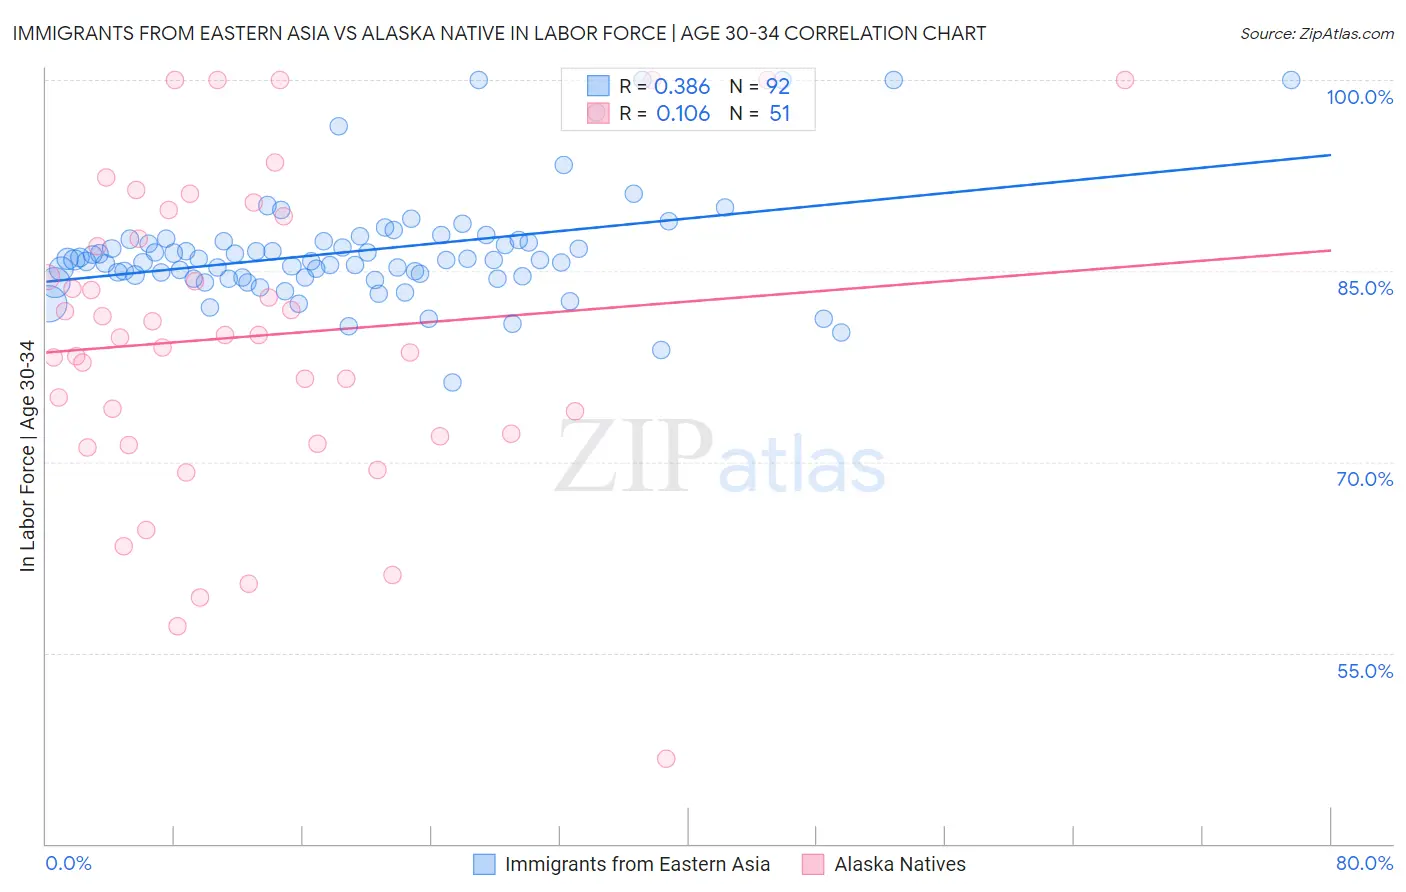
Immigrants from Eastern Asia vs Alaska Native In Labor Force | Age 30-34 Correlation Chart
The statistical analysis conducted on geographies consisting of 499,420,664 people shows a mild positive correlation between the proportion of Immigrants from Eastern Asia and labor force participation rate among population between the ages 30 and 34 in the United States with a correlation coefficient (R) of 0.386 and weighted average of 85.4%. Similarly, the statistical analysis conducted on geographies consisting of 76,755,114 people shows a poor positive correlation between the proportion of Alaska Natives and labor force participation rate among population between the ages 30 and 34 in the United States with a correlation coefficient (R) of 0.106 and weighted average of 81.3%, a difference of 4.9%.
In Labor Force | Age 30-34 Correlation Summary
| Measurement | Immigrants from Eastern Asia | Alaska Native |
| Minimum | 76.2% | 46.7% |
| Maximum | 100.0% | 100.0% |
| Range | 23.8% | 53.3% |
| Mean | 86.6% | 79.9% |
| Median | 85.9% | 80.0% |
| Interquartile 25% (IQ1) | 84.5% | 72.0% |
| Interquartile 75% (IQ3) | 87.4% | 89.3% |
| Interquartile Range (IQR) | 2.9% | 17.3% |
| Standard Deviation (Sample) | 4.4% | 12.2% |
| Standard Deviation (Population) | 4.4% | 12.1% |
Similar Demographics by In Labor Force | Age 30-34
Demographics Similar to Immigrants from Eastern Asia by In Labor Force | Age 30-34
In terms of in labor force | age 30-34, the demographic groups most similar to Immigrants from Eastern Asia are Immigrants from Czechoslovakia (85.4%, a difference of 0.010%), Iranian (85.4%, a difference of 0.010%), Brazilian (85.4%, a difference of 0.020%), Immigrants from Japan (85.4%, a difference of 0.020%), and Immigrants from China (85.4%, a difference of 0.020%).
| Demographics | Rating | Rank | In Labor Force | Age 30-34 |
| Brazilians | 99.1 /100 | #70 | Exceptional 85.4% |
| Immigrants | Japan | 99.1 /100 | #71 | Exceptional 85.4% |
| Immigrants | China | 99.0 /100 | #72 | Exceptional 85.4% |
| Indians (Asian) | 99.0 /100 | #73 | Exceptional 85.4% |
| Maltese | 99.0 /100 | #74 | Exceptional 85.4% |
| Immigrants | Czechoslovakia | 99.0 /100 | #75 | Exceptional 85.4% |
| Iranians | 99.0 /100 | #76 | Exceptional 85.4% |
| Immigrants | Eastern Asia | 98.9 /100 | #77 | Exceptional 85.4% |
| Immigrants | Singapore | 98.8 /100 | #78 | Exceptional 85.3% |
| Immigrants | Switzerland | 98.7 /100 | #79 | Exceptional 85.3% |
| Immigrants | Russia | 98.7 /100 | #80 | Exceptional 85.3% |
| Slovaks | 98.7 /100 | #81 | Exceptional 85.3% |
| Immigrants | Africa | 98.6 /100 | #82 | Exceptional 85.3% |
| Immigrants | Europe | 98.6 /100 | #83 | Exceptional 85.3% |
| Greeks | 98.6 /100 | #84 | Exceptional 85.3% |
Demographics Similar to Alaska Natives by In Labor Force | Age 30-34
In terms of in labor force | age 30-34, the demographic groups most similar to Alaska Natives are Yaqui (81.4%, a difference of 0.080%), Choctaw (81.4%, a difference of 0.10%), Shoshone (81.4%, a difference of 0.10%), Puerto Rican (81.2%, a difference of 0.16%), and Immigrants from the Azores (81.5%, a difference of 0.18%).
| Demographics | Rating | Rank | In Labor Force | Age 30-34 |
| Alaskan Athabascans | 0.0 /100 | #314 | Tragic 81.7% |
| Cherokee | 0.0 /100 | #315 | Tragic 81.6% |
| Immigrants | Azores | 0.0 /100 | #316 | Tragic 81.5% |
| Arapaho | 0.0 /100 | #317 | Tragic 81.5% |
| Choctaw | 0.0 /100 | #318 | Tragic 81.4% |
| Shoshone | 0.0 /100 | #319 | Tragic 81.4% |
| Yaqui | 0.0 /100 | #320 | Tragic 81.4% |
| Alaska Natives | 0.0 /100 | #321 | Tragic 81.3% |
| Puerto Ricans | 0.0 /100 | #322 | Tragic 81.2% |
| Paiute | 0.0 /100 | #323 | Tragic 81.2% |
| Cheyenne | 0.0 /100 | #324 | Tragic 81.1% |
| Dutch West Indians | 0.0 /100 | #325 | Tragic 81.0% |
| Seminole | 0.0 /100 | #326 | Tragic 80.8% |
| Colville | 0.0 /100 | #327 | Tragic 80.7% |
| Sioux | 0.0 /100 | #328 | Tragic 80.4% |