Immigrants from Eastern Asia vs Alaska Native Unemployment Among Ages 16 to 19 years
COMPARE
Immigrants from Eastern Asia
Alaska Native
Unemployment Among Ages 16 to 19 years
Unemployment Among Ages 16 to 19 years Comparison
Immigrants from Eastern Asia
Alaska Natives
17.4%
UNEMPLOYMENT AMONG AGES 16 TO 19 YEARS
73.8/ 100
METRIC RATING
149th/ 347
METRIC RANK
21.8%
UNEMPLOYMENT AMONG AGES 16 TO 19 YEARS
0.0/ 100
METRIC RATING
314th/ 347
METRIC RANK
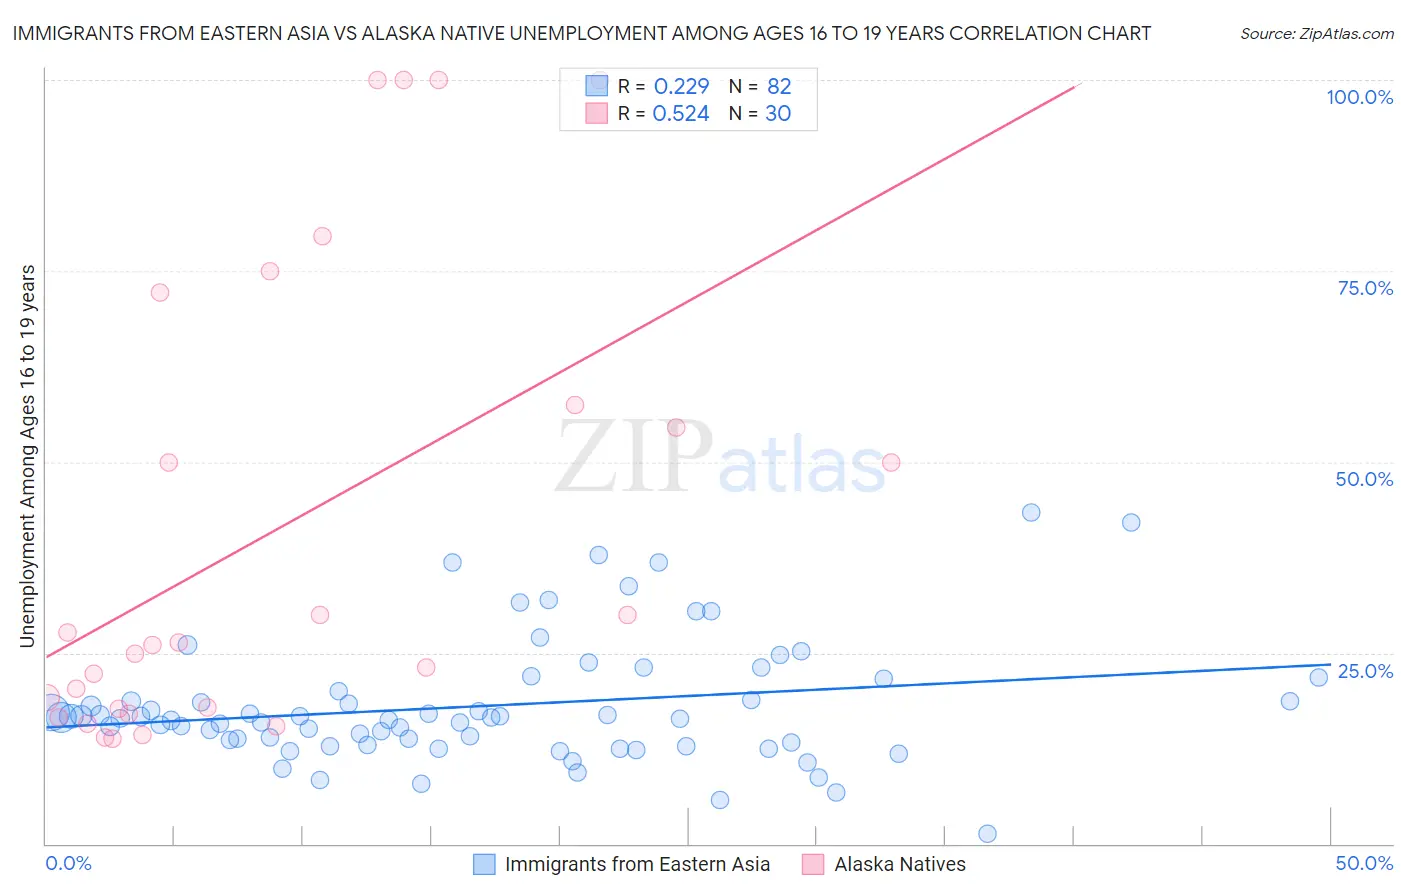
Immigrants from Eastern Asia vs Alaska Native Unemployment Among Ages 16 to 19 years Correlation Chart
The statistical analysis conducted on geographies consisting of 464,161,035 people shows a weak positive correlation between the proportion of Immigrants from Eastern Asia and unemployment rate among population between the ages 16 and 19 in the United States with a correlation coefficient (R) of 0.229 and weighted average of 17.4%. Similarly, the statistical analysis conducted on geographies consisting of 76,044,385 people shows a substantial positive correlation between the proportion of Alaska Natives and unemployment rate among population between the ages 16 and 19 in the United States with a correlation coefficient (R) of 0.524 and weighted average of 21.8%, a difference of 25.3%.
Unemployment Among Ages 16 to 19 years Correlation Summary
| Measurement | Immigrants from Eastern Asia | Alaska Native |
| Minimum | 1.3% | 13.8% |
| Maximum | 43.4% | 100.0% |
| Range | 42.1% | 86.2% |
| Mean | 18.0% | 41.0% |
| Median | 16.5% | 26.2% |
| Interquartile 25% (IQ1) | 13.3% | 17.7% |
| Interquartile 75% (IQ3) | 19.9% | 57.5% |
| Interquartile Range (IQR) | 6.6% | 39.7% |
| Standard Deviation (Sample) | 8.1% | 30.3% |
| Standard Deviation (Population) | 8.0% | 29.8% |
Similar Demographics by Unemployment Among Ages 16 to 19 years
Demographics Similar to Immigrants from Eastern Asia by Unemployment Among Ages 16 to 19 years
In terms of unemployment among ages 16 to 19 years, the demographic groups most similar to Immigrants from Eastern Asia are Romanian (17.3%, a difference of 0.070%), Immigrants from Northern Europe (17.4%, a difference of 0.080%), Tsimshian (17.3%, a difference of 0.14%), Turkish (17.3%, a difference of 0.21%), and Indian (Asian) (17.3%, a difference of 0.25%).
| Demographics | Rating | Rank | Unemployment Among Ages 16 to 19 years |
| Spanish | 79.3 /100 | #142 | Good 17.3% |
| Immigrants | Egypt | 79.1 /100 | #143 | Good 17.3% |
| Immigrants | England | 78.9 /100 | #144 | Good 17.3% |
| Indians (Asian) | 77.6 /100 | #145 | Good 17.3% |
| Turks | 77.1 /100 | #146 | Good 17.3% |
| Tsimshian | 76.0 /100 | #147 | Good 17.3% |
| Romanians | 74.9 /100 | #148 | Good 17.3% |
| Immigrants | Eastern Asia | 73.8 /100 | #149 | Good 17.4% |
| Immigrants | Northern Europe | 72.5 /100 | #150 | Good 17.4% |
| Immigrants | Hong Kong | 69.3 /100 | #151 | Good 17.4% |
| Immigrants | Northern Africa | 69.0 /100 | #152 | Good 17.4% |
| Immigrants | Afghanistan | 68.6 /100 | #153 | Good 17.4% |
| Afghans | 68.1 /100 | #154 | Good 17.4% |
| Portuguese | 67.3 /100 | #155 | Good 17.4% |
| Costa Ricans | 65.9 /100 | #156 | Good 17.4% |
Demographics Similar to Alaska Natives by Unemployment Among Ages 16 to 19 years
In terms of unemployment among ages 16 to 19 years, the demographic groups most similar to Alaska Natives are Jamaican (21.7%, a difference of 0.16%), Houma (21.6%, a difference of 0.58%), Belizean (21.6%, a difference of 0.84%), Immigrants from Dominica (21.9%, a difference of 0.85%), and Vietnamese (21.5%, a difference of 1.1%).
| Demographics | Rating | Rank | Unemployment Among Ages 16 to 19 years |
| Blacks/African Americans | 0.0 /100 | #307 | Tragic 21.4% |
| Immigrants | Bangladesh | 0.0 /100 | #308 | Tragic 21.5% |
| Natives/Alaskans | 0.0 /100 | #309 | Tragic 21.5% |
| Vietnamese | 0.0 /100 | #310 | Tragic 21.5% |
| Belizeans | 0.0 /100 | #311 | Tragic 21.6% |
| Houma | 0.0 /100 | #312 | Tragic 21.6% |
| Jamaicans | 0.0 /100 | #313 | Tragic 21.7% |
| Alaska Natives | 0.0 /100 | #314 | Tragic 21.8% |
| Immigrants | Dominica | 0.0 /100 | #315 | Tragic 21.9% |
| Tohono O'odham | 0.0 /100 | #316 | Tragic 22.1% |
| Immigrants | Belize | 0.0 /100 | #317 | Tragic 22.2% |
| Immigrants | Jamaica | 0.0 /100 | #318 | Tragic 22.2% |
| Immigrants | West Indies | 0.0 /100 | #319 | Tragic 22.2% |
| Cheyenne | 0.0 /100 | #320 | Tragic 22.3% |
| West Indians | 0.0 /100 | #321 | Tragic 22.4% |