Immigrants from Eastern Asia vs Immigrants from Morocco Median Earnings
COMPARE
Immigrants from Eastern Asia
Immigrants from Morocco
Median Earnings
Median Earnings Comparison
Immigrants from Eastern Asia
Immigrants from Morocco
$56,183
MEDIAN EARNINGS
100.0/ 100
METRIC RATING
16th/ 347
METRIC RANK
$49,368
MEDIAN EARNINGS
98.4/ 100
METRIC RATING
107th/ 347
METRIC RANK
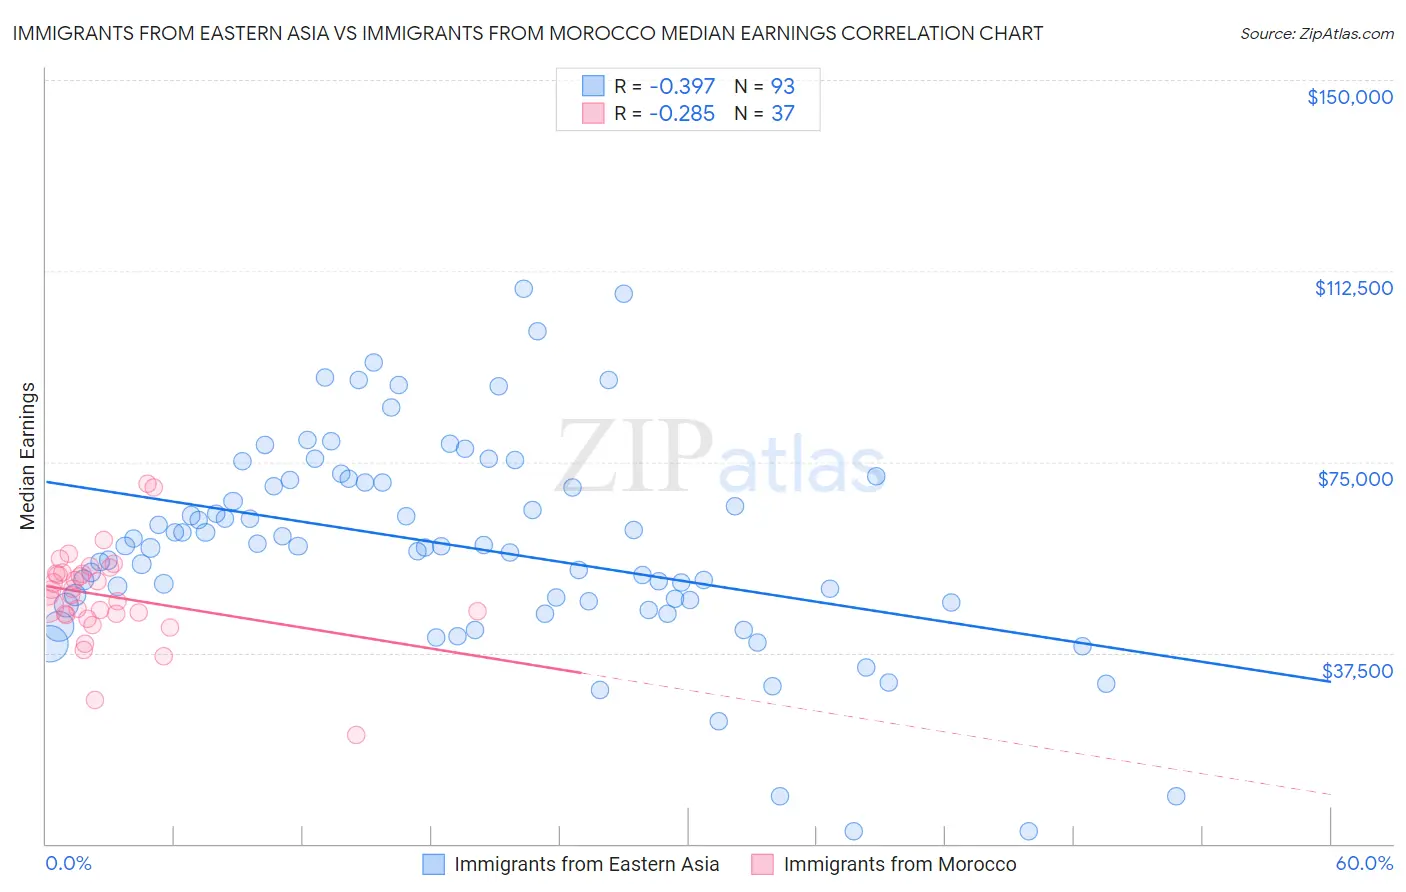
Immigrants from Eastern Asia vs Immigrants from Morocco Median Earnings Correlation Chart
The statistical analysis conducted on geographies consisting of 499,910,866 people shows a mild negative correlation between the proportion of Immigrants from Eastern Asia and median earnings in the United States with a correlation coefficient (R) of -0.397 and weighted average of $56,183. Similarly, the statistical analysis conducted on geographies consisting of 178,911,278 people shows a weak negative correlation between the proportion of Immigrants from Morocco and median earnings in the United States with a correlation coefficient (R) of -0.285 and weighted average of $49,368, a difference of 13.8%.
Median Earnings Correlation Summary
| Measurement | Immigrants from Eastern Asia | Immigrants from Morocco |
| Minimum | $2,499 | $21,250 |
| Maximum | $109,069 | $70,625 |
| Range | $106,570 | $49,375 |
| Mean | $58,494 | $48,644 |
| Median | $58,436 | $48,771 |
| Interquartile 25% (IQ1) | $47,510 | $45,090 |
| Interquartile 75% (IQ3) | $71,190 | $53,191 |
| Interquartile Range (IQR) | $23,680 | $8,101 |
| Standard Deviation (Sample) | $20,635 | $9,241 |
| Standard Deviation (Population) | $20,524 | $9,116 |
Similar Demographics by Median Earnings
Demographics Similar to Immigrants from Eastern Asia by Median Earnings
In terms of median earnings, the demographic groups most similar to Immigrants from Eastern Asia are Indian (Asian) ($56,253, a difference of 0.12%), Immigrants from Australia ($56,305, a difference of 0.22%), Immigrants from China ($56,638, a difference of 0.81%), Immigrants from Ireland ($56,854, a difference of 1.2%), and Immigrants from Israel ($57,034, a difference of 1.5%).
| Demographics | Rating | Rank | Median Earnings |
| Okinawans | 100.0 /100 | #9 | Exceptional $57,550 |
| Immigrants | South Central Asia | 100.0 /100 | #10 | Exceptional $57,114 |
| Immigrants | Israel | 100.0 /100 | #11 | Exceptional $57,034 |
| Immigrants | Ireland | 100.0 /100 | #12 | Exceptional $56,854 |
| Immigrants | China | 100.0 /100 | #13 | Exceptional $56,638 |
| Immigrants | Australia | 100.0 /100 | #14 | Exceptional $56,305 |
| Indians (Asian) | 100.0 /100 | #15 | Exceptional $56,253 |
| Immigrants | Eastern Asia | 100.0 /100 | #16 | Exceptional $56,183 |
| Eastern Europeans | 100.0 /100 | #17 | Exceptional $55,084 |
| Immigrants | Japan | 100.0 /100 | #18 | Exceptional $54,938 |
| Immigrants | Belgium | 100.0 /100 | #19 | Exceptional $54,679 |
| Cypriots | 100.0 /100 | #20 | Exceptional $54,589 |
| Burmese | 100.0 /100 | #21 | Exceptional $54,559 |
| Immigrants | Korea | 100.0 /100 | #22 | Exceptional $54,530 |
| Immigrants | Sweden | 100.0 /100 | #23 | Exceptional $54,478 |
Demographics Similar to Immigrants from Morocco by Median Earnings
In terms of median earnings, the demographic groups most similar to Immigrants from Morocco are Immigrants from Albania ($49,377, a difference of 0.020%), Immigrants from Western Asia ($49,389, a difference of 0.040%), Immigrants from Brazil ($49,463, a difference of 0.19%), Austrian ($49,501, a difference of 0.27%), and Palestinian ($49,209, a difference of 0.32%).
| Demographics | Rating | Rank | Median Earnings |
| Immigrants | Poland | 98.9 /100 | #100 | Exceptional $49,633 |
| Jordanians | 98.9 /100 | #101 | Exceptional $49,632 |
| Ethiopians | 98.8 /100 | #102 | Exceptional $49,572 |
| Austrians | 98.7 /100 | #103 | Exceptional $49,501 |
| Immigrants | Brazil | 98.6 /100 | #104 | Exceptional $49,463 |
| Immigrants | Western Asia | 98.4 /100 | #105 | Exceptional $49,389 |
| Immigrants | Albania | 98.4 /100 | #106 | Exceptional $49,377 |
| Immigrants | Morocco | 98.4 /100 | #107 | Exceptional $49,368 |
| Palestinians | 98.0 /100 | #108 | Exceptional $49,209 |
| Syrians | 97.1 /100 | #109 | Exceptional $48,934 |
| Immigrants | Ethiopia | 97.1 /100 | #110 | Exceptional $48,924 |
| Immigrants | Zimbabwe | 97.0 /100 | #111 | Exceptional $48,913 |
| Northern Europeans | 96.9 /100 | #112 | Exceptional $48,887 |
| Immigrants | Kuwait | 96.8 /100 | #113 | Exceptional $48,861 |
| Moroccans | 96.7 /100 | #114 | Exceptional $48,838 |