Basque vs Immigrants from Israel Median Earnings
COMPARE
Basque
Immigrants from Israel
Median Earnings
Median Earnings Comparison
Basques
Immigrants from Israel
$46,399
MEDIAN EARNINGS
48.8/ 100
METRIC RATING
175th/ 347
METRIC RANK
$57,034
MEDIAN EARNINGS
100.0/ 100
METRIC RATING
11th/ 347
METRIC RANK
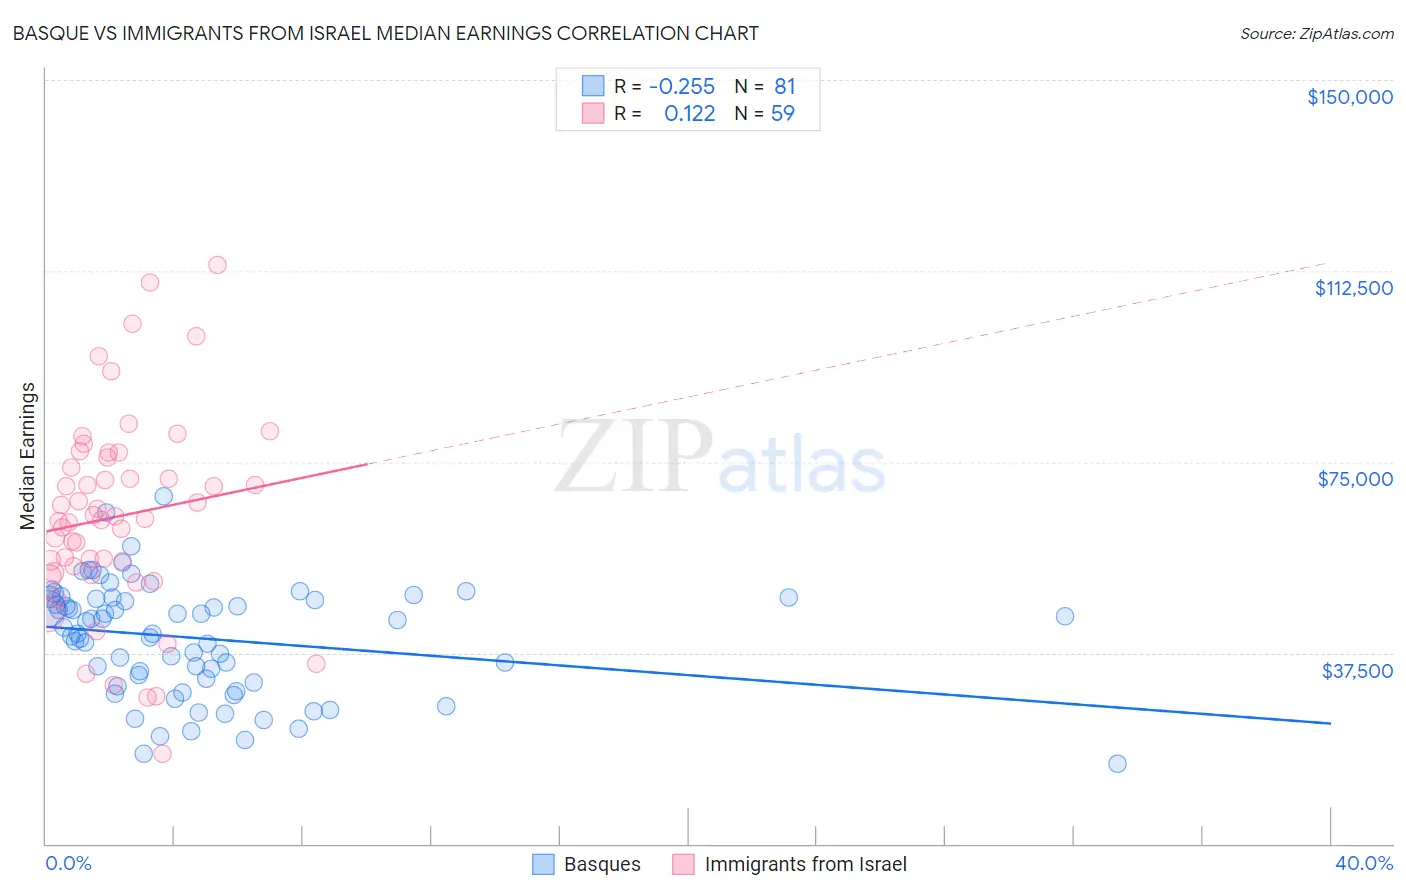
Basque vs Immigrants from Israel Median Earnings Correlation Chart
The statistical analysis conducted on geographies consisting of 165,772,846 people shows a weak negative correlation between the proportion of Basques and median earnings in the United States with a correlation coefficient (R) of -0.255 and weighted average of $46,399. Similarly, the statistical analysis conducted on geographies consisting of 210,025,881 people shows a poor positive correlation between the proportion of Immigrants from Israel and median earnings in the United States with a correlation coefficient (R) of 0.122 and weighted average of $57,034, a difference of 22.9%.
Median Earnings Correlation Summary
| Measurement | Basque | Immigrants from Israel |
| Minimum | $15,833 | $17,782 |
| Maximum | $68,304 | $113,636 |
| Range | $52,471 | $95,854 |
| Mean | $40,382 | $64,255 |
| Median | $42,566 | $63,844 |
| Interquartile 25% (IQ1) | $32,007 | $53,296 |
| Interquartile 75% (IQ3) | $48,221 | $75,870 |
| Interquartile Range (IQR) | $16,214 | $22,574 |
| Standard Deviation (Sample) | $10,903 | $19,481 |
| Standard Deviation (Population) | $10,835 | $19,315 |
Similar Demographics by Median Earnings
Demographics Similar to Basques by Median Earnings
In terms of median earnings, the demographic groups most similar to Basques are Danish ($46,392, a difference of 0.020%), Belgian ($46,375, a difference of 0.050%), Scandinavian ($46,433, a difference of 0.070%), Ghanaian ($46,440, a difference of 0.090%), and Colombian ($46,349, a difference of 0.11%).
| Demographics | Rating | Rank | Median Earnings |
| Immigrants | Africa | 54.6 /100 | #168 | Average $46,564 |
| Immigrants | South America | 54.0 /100 | #169 | Average $46,548 |
| Immigrants | Immigrants | 51.6 /100 | #170 | Average $46,478 |
| Scottish | 51.1 /100 | #171 | Average $46,463 |
| Kenyans | 51.0 /100 | #172 | Average $46,462 |
| Ghanaians | 50.3 /100 | #173 | Average $46,440 |
| Scandinavians | 50.0 /100 | #174 | Average $46,433 |
| Basques | 48.8 /100 | #175 | Average $46,399 |
| Danes | 48.6 /100 | #176 | Average $46,392 |
| Belgians | 48.0 /100 | #177 | Average $46,375 |
| Colombians | 47.1 /100 | #178 | Average $46,349 |
| English | 46.5 /100 | #179 | Average $46,334 |
| Puget Sound Salish | 46.5 /100 | #180 | Average $46,333 |
| Immigrants | Cameroon | 46.4 /100 | #181 | Average $46,329 |
| Swiss | 45.9 /100 | #182 | Average $46,315 |
Demographics Similar to Immigrants from Israel by Median Earnings
In terms of median earnings, the demographic groups most similar to Immigrants from Israel are Immigrants from South Central Asia ($57,114, a difference of 0.14%), Immigrants from Ireland ($56,854, a difference of 0.32%), Immigrants from China ($56,638, a difference of 0.70%), Okinawan ($57,550, a difference of 0.90%), and Immigrants from Iran ($57,612, a difference of 1.0%).
| Demographics | Rating | Rank | Median Earnings |
| Immigrants | Hong Kong | 100.0 /100 | #4 | Exceptional $59,433 |
| Thais | 100.0 /100 | #5 | Exceptional $59,237 |
| Immigrants | Singapore | 100.0 /100 | #6 | Exceptional $59,038 |
| Iranians | 100.0 /100 | #7 | Exceptional $58,474 |
| Immigrants | Iran | 100.0 /100 | #8 | Exceptional $57,612 |
| Okinawans | 100.0 /100 | #9 | Exceptional $57,550 |
| Immigrants | South Central Asia | 100.0 /100 | #10 | Exceptional $57,114 |
| Immigrants | Israel | 100.0 /100 | #11 | Exceptional $57,034 |
| Immigrants | Ireland | 100.0 /100 | #12 | Exceptional $56,854 |
| Immigrants | China | 100.0 /100 | #13 | Exceptional $56,638 |
| Immigrants | Australia | 100.0 /100 | #14 | Exceptional $56,305 |
| Indians (Asian) | 100.0 /100 | #15 | Exceptional $56,253 |
| Immigrants | Eastern Asia | 100.0 /100 | #16 | Exceptional $56,183 |
| Eastern Europeans | 100.0 /100 | #17 | Exceptional $55,084 |
| Immigrants | Japan | 100.0 /100 | #18 | Exceptional $54,938 |