Immigrants from Cameroon vs Immigrants from Netherlands Unemployment Among Ages 20 to 24 years
COMPARE
Immigrants from Cameroon
Immigrants from Netherlands
Unemployment Among Ages 20 to 24 years
Unemployment Among Ages 20 to 24 years Comparison
Immigrants from Cameroon
Immigrants from Netherlands
11.7%
UNEMPLOYMENT AMONG AGES 20 TO 24 YEARS
0.0/ 100
METRIC RATING
282nd/ 347
METRIC RANK
9.9%
UNEMPLOYMENT AMONG AGES 20 TO 24 YEARS
98.2/ 100
METRIC RATING
80th/ 347
METRIC RANK
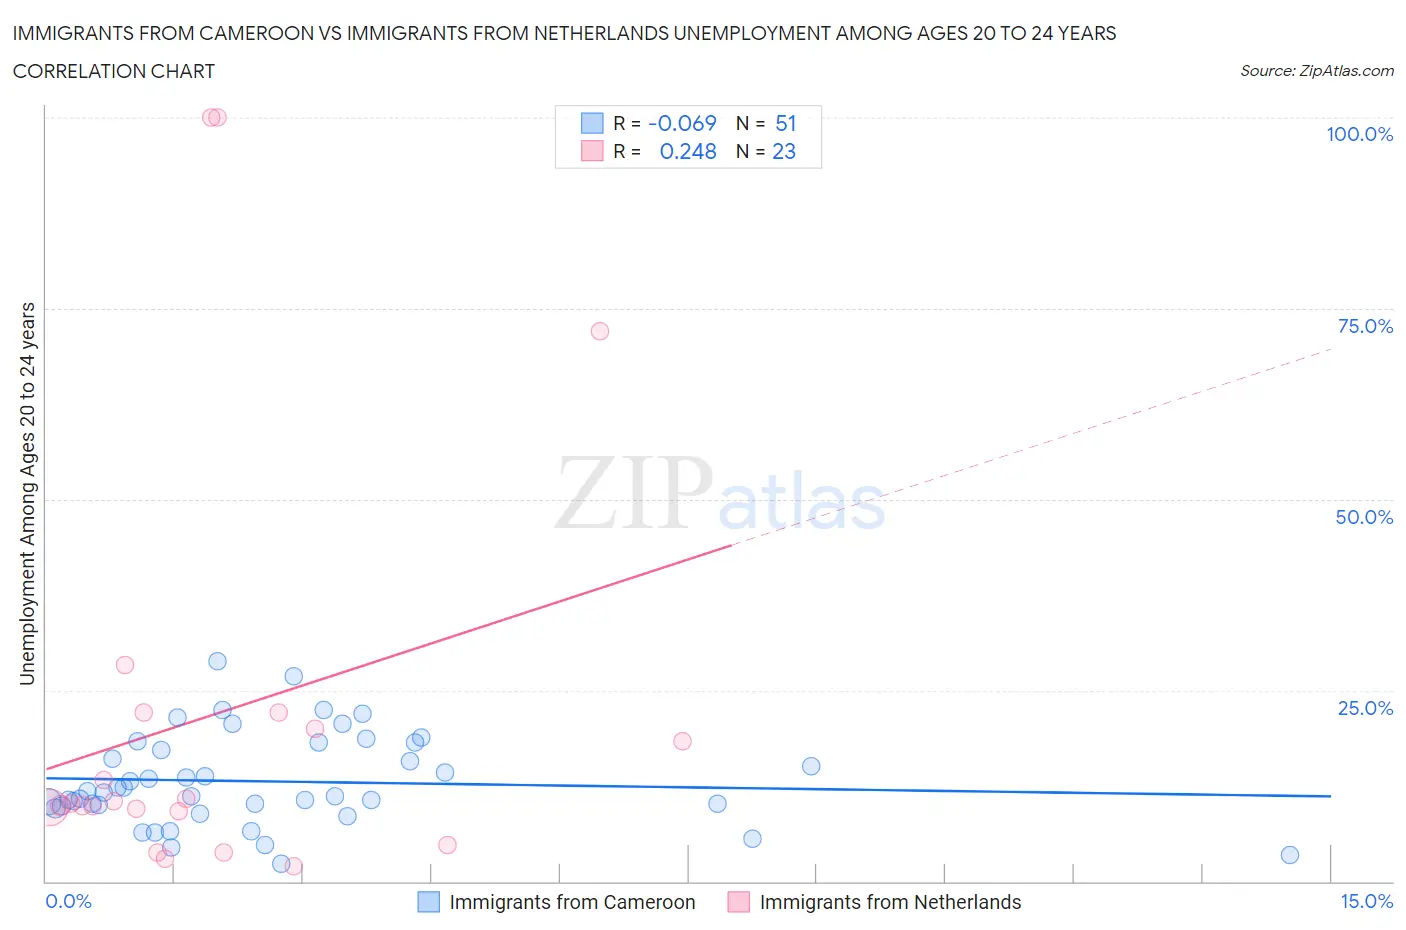
Immigrants from Cameroon vs Immigrants from Netherlands Unemployment Among Ages 20 to 24 years Correlation Chart
The statistical analysis conducted on geographies consisting of 129,677,479 people shows a slight negative correlation between the proportion of Immigrants from Cameroon and unemployment rate among population between the ages 20 and 24 in the United States with a correlation coefficient (R) of -0.069 and weighted average of 11.7%. Similarly, the statistical analysis conducted on geographies consisting of 232,390,295 people shows a weak positive correlation between the proportion of Immigrants from Netherlands and unemployment rate among population between the ages 20 and 24 in the United States with a correlation coefficient (R) of 0.248 and weighted average of 9.9%, a difference of 17.8%.
Unemployment Among Ages 20 to 24 years Correlation Summary
| Measurement | Immigrants from Cameroon | Immigrants from Netherlands |
| Minimum | 2.3% | 2.0% |
| Maximum | 28.7% | 100.0% |
| Range | 26.5% | 98.0% |
| Mean | 13.1% | 21.9% |
| Median | 11.6% | 10.2% |
| Interquartile 25% (IQ1) | 9.9% | 9.2% |
| Interquartile 75% (IQ3) | 18.2% | 22.1% |
| Interquartile Range (IQR) | 8.3% | 12.9% |
| Standard Deviation (Sample) | 6.0% | 28.5% |
| Standard Deviation (Population) | 5.9% | 27.8% |
Similar Demographics by Unemployment Among Ages 20 to 24 years
Demographics Similar to Immigrants from Cameroon by Unemployment Among Ages 20 to 24 years
In terms of unemployment among ages 20 to 24 years, the demographic groups most similar to Immigrants from Cameroon are Armenian (11.7%, a difference of 0.15%), Ghanaian (11.7%, a difference of 0.34%), Immigrants from Western Africa (11.7%, a difference of 0.35%), Soviet Union (11.7%, a difference of 0.39%), and Ecuadorian (11.8%, a difference of 0.51%).
| Demographics | Rating | Rank | Unemployment Among Ages 20 to 24 years |
| Senegalese | 0.0 /100 | #275 | Tragic 11.5% |
| Sierra Leoneans | 0.0 /100 | #276 | Tragic 11.5% |
| Africans | 0.0 /100 | #277 | Tragic 11.5% |
| Colville | 0.0 /100 | #278 | Tragic 11.6% |
| Bahamians | 0.0 /100 | #279 | Tragic 11.6% |
| Alaskan Athabascans | 0.0 /100 | #280 | Tragic 11.6% |
| Armenians | 0.0 /100 | #281 | Tragic 11.7% |
| Immigrants | Cameroon | 0.0 /100 | #282 | Tragic 11.7% |
| Ghanaians | 0.0 /100 | #283 | Tragic 11.7% |
| Immigrants | Western Africa | 0.0 /100 | #284 | Tragic 11.7% |
| Soviet Union | 0.0 /100 | #285 | Tragic 11.7% |
| Ecuadorians | 0.0 /100 | #286 | Tragic 11.8% |
| Immigrants | Ecuador | 0.0 /100 | #287 | Tragic 11.8% |
| U.S. Virgin Islanders | 0.0 /100 | #288 | Tragic 11.8% |
| Belizeans | 0.0 /100 | #289 | Tragic 11.8% |
Demographics Similar to Immigrants from Netherlands by Unemployment Among Ages 20 to 24 years
In terms of unemployment among ages 20 to 24 years, the demographic groups most similar to Immigrants from Netherlands are Icelander (9.9%, a difference of 0.040%), Assyrian/Chaldean/Syriac (9.9%, a difference of 0.070%), Chickasaw (9.9%, a difference of 0.10%), Yaqui (9.9%, a difference of 0.11%), and Czechoslovakian (9.9%, a difference of 0.12%).
| Demographics | Rating | Rank | Unemployment Among Ages 20 to 24 years |
| Kenyans | 98.7 /100 | #73 | Exceptional 9.9% |
| Immigrants | Laos | 98.7 /100 | #74 | Exceptional 9.9% |
| Immigrants | Australia | 98.6 /100 | #75 | Exceptional 9.9% |
| Czechoslovakians | 98.4 /100 | #76 | Exceptional 9.9% |
| Chickasaw | 98.4 /100 | #77 | Exceptional 9.9% |
| Assyrians/Chaldeans/Syriacs | 98.3 /100 | #78 | Exceptional 9.9% |
| Icelanders | 98.3 /100 | #79 | Exceptional 9.9% |
| Immigrants | Netherlands | 98.2 /100 | #80 | Exceptional 9.9% |
| Yaqui | 98.0 /100 | #81 | Exceptional 9.9% |
| Sri Lankans | 98.0 /100 | #82 | Exceptional 9.9% |
| Immigrants | Bulgaria | 98.0 /100 | #83 | Exceptional 9.9% |
| Latvians | 97.9 /100 | #84 | Exceptional 9.9% |
| New Zealanders | 97.8 /100 | #85 | Exceptional 9.9% |
| Immigrants | Vietnam | 97.5 /100 | #86 | Exceptional 10.0% |
| Immigrants | Oceania | 97.4 /100 | #87 | Exceptional 10.0% |