Immigrants from Cameroon vs Immigrants from Netherlands Bachelor's Degree
COMPARE
Immigrants from Cameroon
Immigrants from Netherlands
Bachelor's Degree
Bachelor's Degree Comparison
Immigrants from Cameroon
Immigrants from Netherlands
37.7%
BACHELOR'S DEGREE
46.8/ 100
METRIC RATING
178th/ 347
METRIC RANK
43.3%
BACHELOR'S DEGREE
99.7/ 100
METRIC RATING
66th/ 347
METRIC RANK
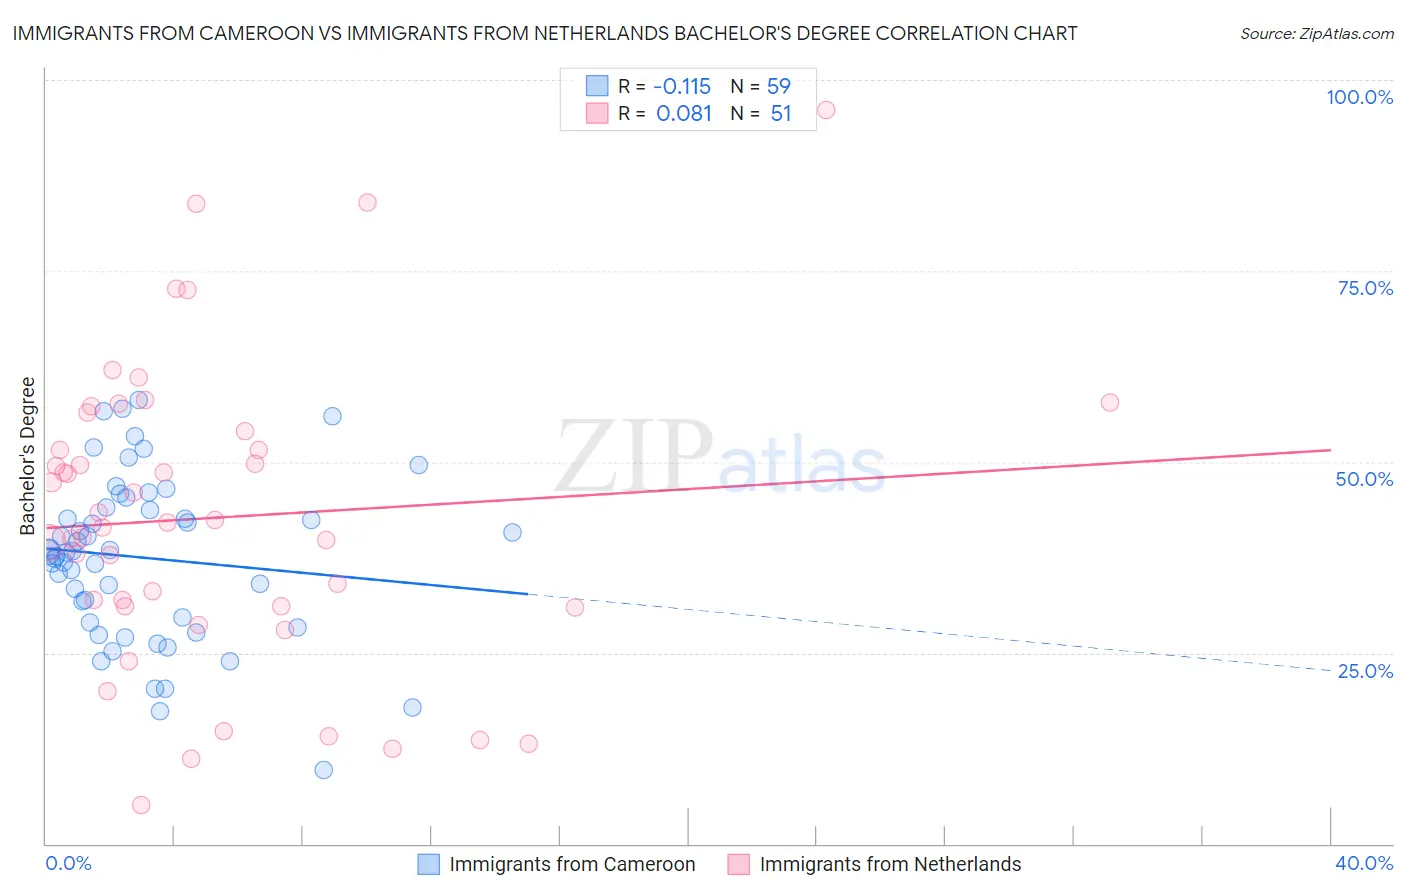
Immigrants from Cameroon vs Immigrants from Netherlands Bachelor's Degree Correlation Chart
The statistical analysis conducted on geographies consisting of 130,767,721 people shows a poor negative correlation between the proportion of Immigrants from Cameroon and percentage of population with at least bachelor's degree education in the United States with a correlation coefficient (R) of -0.115 and weighted average of 37.7%. Similarly, the statistical analysis conducted on geographies consisting of 237,874,454 people shows a slight positive correlation between the proportion of Immigrants from Netherlands and percentage of population with at least bachelor's degree education in the United States with a correlation coefficient (R) of 0.081 and weighted average of 43.3%, a difference of 14.8%.
Bachelor's Degree Correlation Summary
| Measurement | Immigrants from Cameroon | Immigrants from Netherlands |
| Minimum | 9.6% | 5.0% |
| Maximum | 58.0% | 96.1% |
| Range | 48.4% | 91.1% |
| Mean | 37.4% | 42.7% |
| Median | 38.2% | 42.1% |
| Interquartile 25% (IQ1) | 28.9% | 31.0% |
| Interquartile 75% (IQ3) | 44.1% | 54.0% |
| Interquartile Range (IQR) | 15.1% | 23.0% |
| Standard Deviation (Sample) | 10.7% | 19.6% |
| Standard Deviation (Population) | 10.6% | 19.4% |
Similar Demographics by Bachelor's Degree
Demographics Similar to Immigrants from Cameroon by Bachelor's Degree
In terms of bachelor's degree, the demographic groups most similar to Immigrants from Cameroon are Basque (37.7%, a difference of 0.060%), Costa Rican (37.7%, a difference of 0.080%), Immigrants from Colombia (37.7%, a difference of 0.13%), Immigrants from Uruguay (37.8%, a difference of 0.15%), and Irish (37.6%, a difference of 0.24%).
| Demographics | Rating | Rank | Bachelor's Degree |
| Bermudans | 54.2 /100 | #171 | Average 38.0% |
| Immigrants | Somalia | 52.8 /100 | #172 | Average 37.9% |
| Immigrants | Iraq | 52.5 /100 | #173 | Average 37.9% |
| Immigrants | Bangladesh | 50.0 /100 | #174 | Average 37.8% |
| Immigrants | Uruguay | 48.3 /100 | #175 | Average 37.8% |
| Costa Ricans | 47.6 /100 | #176 | Average 37.7% |
| Basques | 47.4 /100 | #177 | Average 37.7% |
| Immigrants | Cameroon | 46.8 /100 | #178 | Average 37.7% |
| Immigrants | Colombia | 45.4 /100 | #179 | Average 37.7% |
| Irish | 44.3 /100 | #180 | Average 37.6% |
| Immigrants | Senegal | 43.8 /100 | #181 | Average 37.6% |
| Immigrants | Bosnia and Herzegovina | 43.4 /100 | #182 | Average 37.6% |
| Senegalese | 42.2 /100 | #183 | Average 37.5% |
| Scandinavians | 41.7 /100 | #184 | Average 37.5% |
| Immigrants | Peru | 41.3 /100 | #185 | Average 37.5% |
Demographics Similar to Immigrants from Netherlands by Bachelor's Degree
In terms of bachelor's degree, the demographic groups most similar to Immigrants from Netherlands are Argentinean (43.3%, a difference of 0.020%), Zimbabwean (43.3%, a difference of 0.020%), Egyptian (43.3%, a difference of 0.020%), Immigrants from Indonesia (43.3%, a difference of 0.040%), and Immigrants from Europe (43.4%, a difference of 0.30%).
| Demographics | Rating | Rank | Bachelor's Degree |
| Australians | 99.9 /100 | #59 | Exceptional 44.0% |
| New Zealanders | 99.9 /100 | #60 | Exceptional 44.0% |
| South Africans | 99.8 /100 | #61 | Exceptional 43.6% |
| Immigrants | Kazakhstan | 99.8 /100 | #62 | Exceptional 43.4% |
| Immigrants | Europe | 99.8 /100 | #63 | Exceptional 43.4% |
| Argentineans | 99.7 /100 | #64 | Exceptional 43.3% |
| Zimbabweans | 99.7 /100 | #65 | Exceptional 43.3% |
| Immigrants | Netherlands | 99.7 /100 | #66 | Exceptional 43.3% |
| Egyptians | 99.7 /100 | #67 | Exceptional 43.3% |
| Immigrants | Indonesia | 99.7 /100 | #68 | Exceptional 43.3% |
| Immigrants | Pakistan | 99.7 /100 | #69 | Exceptional 43.1% |
| Immigrants | Romania | 99.6 /100 | #70 | Exceptional 42.9% |
| Immigrants | Argentina | 99.6 /100 | #71 | Exceptional 42.8% |
| Ethiopians | 99.5 /100 | #72 | Exceptional 42.8% |
| Immigrants | Uzbekistan | 99.5 /100 | #73 | Exceptional 42.8% |