Immigrants from Cameroon vs Tohono O'odham Median Household Income
COMPARE
Immigrants from Cameroon
Tohono O'odham
Median Household Income
Median Household Income Comparison
Immigrants from Cameroon
Tohono O'odham
$85,314
MEDIAN HOUSEHOLD INCOME
53.4/ 100
METRIC RATING
173rd/ 347
METRIC RANK
$61,663
MEDIAN HOUSEHOLD INCOME
0.0/ 100
METRIC RATING
344th/ 347
METRIC RANK
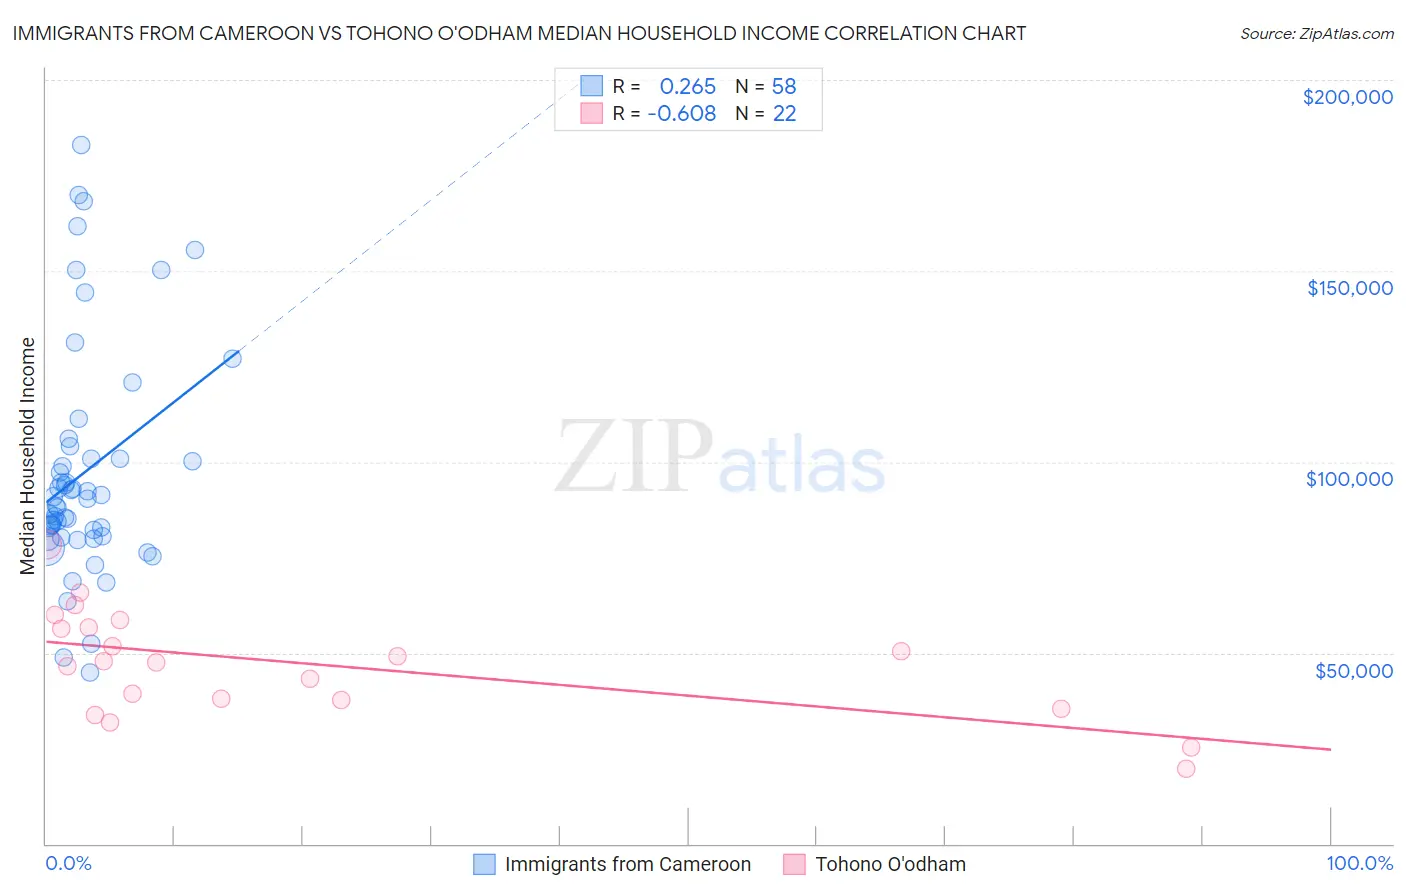
Immigrants from Cameroon vs Tohono O'odham Median Household Income Correlation Chart
The statistical analysis conducted on geographies consisting of 130,731,775 people shows a weak positive correlation between the proportion of Immigrants from Cameroon and median household income in the United States with a correlation coefficient (R) of 0.265 and weighted average of $85,314. Similarly, the statistical analysis conducted on geographies consisting of 58,714,823 people shows a significant negative correlation between the proportion of Tohono O'odham and median household income in the United States with a correlation coefficient (R) of -0.608 and weighted average of $61,663, a difference of 38.4%.
Median Household Income Correlation Summary
| Measurement | Immigrants from Cameroon | Tohono O'odham |
| Minimum | $44,950 | $19,643 |
| Maximum | $182,977 | $78,331 |
| Range | $138,027 | $58,688 |
| Mean | $97,309 | $47,012 |
| Median | $89,399 | $47,638 |
| Interquartile 25% (IQ1) | $80,569 | $37,566 |
| Interquartile 75% (IQ3) | $100,974 | $56,538 |
| Interquartile Range (IQR) | $20,405 | $18,972 |
| Standard Deviation (Sample) | $30,114 | $13,995 |
| Standard Deviation (Population) | $29,854 | $13,673 |
Similar Demographics by Median Household Income
Demographics Similar to Immigrants from Cameroon by Median Household Income
In terms of median household income, the demographic groups most similar to Immigrants from Cameroon are Scottish ($85,101, a difference of 0.25%), Slovene ($85,562, a difference of 0.29%), Immigrants from Costa Rica ($85,054, a difference of 0.31%), Alsatian ($85,053, a difference of 0.31%), and Immigrants from Eritrea ($85,025, a difference of 0.34%).
| Demographics | Rating | Rank | Median Household Income |
| Scandinavians | 65.1 /100 | #166 | Good $86,073 |
| Immigrants | Immigrants | 61.3 /100 | #167 | Good $85,818 |
| Icelanders | 61.0 /100 | #168 | Good $85,797 |
| Colombians | 59.7 /100 | #169 | Average $85,716 |
| Swiss | 59.2 /100 | #170 | Average $85,681 |
| Immigrants | South America | 58.1 /100 | #171 | Average $85,611 |
| Slovenes | 57.4 /100 | #172 | Average $85,562 |
| Immigrants | Cameroon | 53.4 /100 | #173 | Average $85,314 |
| Scottish | 50.0 /100 | #174 | Average $85,101 |
| Immigrants | Costa Rica | 49.2 /100 | #175 | Average $85,054 |
| Alsatians | 49.2 /100 | #176 | Average $85,053 |
| Immigrants | Eritrea | 48.8 /100 | #177 | Average $85,025 |
| Czechoslovakians | 47.8 /100 | #178 | Average $84,965 |
| English | 47.0 /100 | #179 | Average $84,915 |
| Immigrants | Portugal | 44.2 /100 | #180 | Average $84,740 |
Demographics Similar to Tohono O'odham by Median Household Income
In terms of median household income, the demographic groups most similar to Tohono O'odham are Houma ($62,575, a difference of 1.5%), Pima ($63,262, a difference of 2.6%), Crow ($63,681, a difference of 3.3%), Puerto Rican ($59,197, a difference of 4.2%), and Navajo ($59,159, a difference of 4.2%).
| Demographics | Rating | Rank | Median Household Income |
| Creek | 0.0 /100 | #333 | Tragic $67,715 |
| Blacks/African Americans | 0.0 /100 | #334 | Tragic $67,573 |
| Cheyenne | 0.0 /100 | #335 | Tragic $66,974 |
| Immigrants | Congo | 0.0 /100 | #336 | Tragic $66,768 |
| Kiowa | 0.0 /100 | #337 | Tragic $65,914 |
| Immigrants | Yemen | 0.0 /100 | #338 | Tragic $65,194 |
| Hopi | 0.0 /100 | #339 | Tragic $65,043 |
| Pueblo | 0.0 /100 | #340 | Tragic $64,692 |
| Crow | 0.0 /100 | #341 | Tragic $63,681 |
| Pima | 0.0 /100 | #342 | Tragic $63,262 |
| Houma | 0.0 /100 | #343 | Tragic $62,575 |
| Tohono O'odham | 0.0 /100 | #344 | Tragic $61,663 |
| Puerto Ricans | 0.0 /100 | #345 | Tragic $59,197 |
| Navajo | 0.0 /100 | #346 | Tragic $59,159 |
| Lumbee | 0.0 /100 | #347 | Tragic $54,644 |