Immigrants from Cambodia vs Nicaraguan Per Capita Income
COMPARE
Immigrants from Cambodia
Nicaraguan
Per Capita Income
Per Capita Income Comparison
Immigrants from Cambodia
Nicaraguans
$40,434
PER CAPITA INCOME
2.6/ 100
METRIC RATING
237th/ 347
METRIC RANK
$39,372
PER CAPITA INCOME
0.8/ 100
METRIC RATING
257th/ 347
METRIC RANK
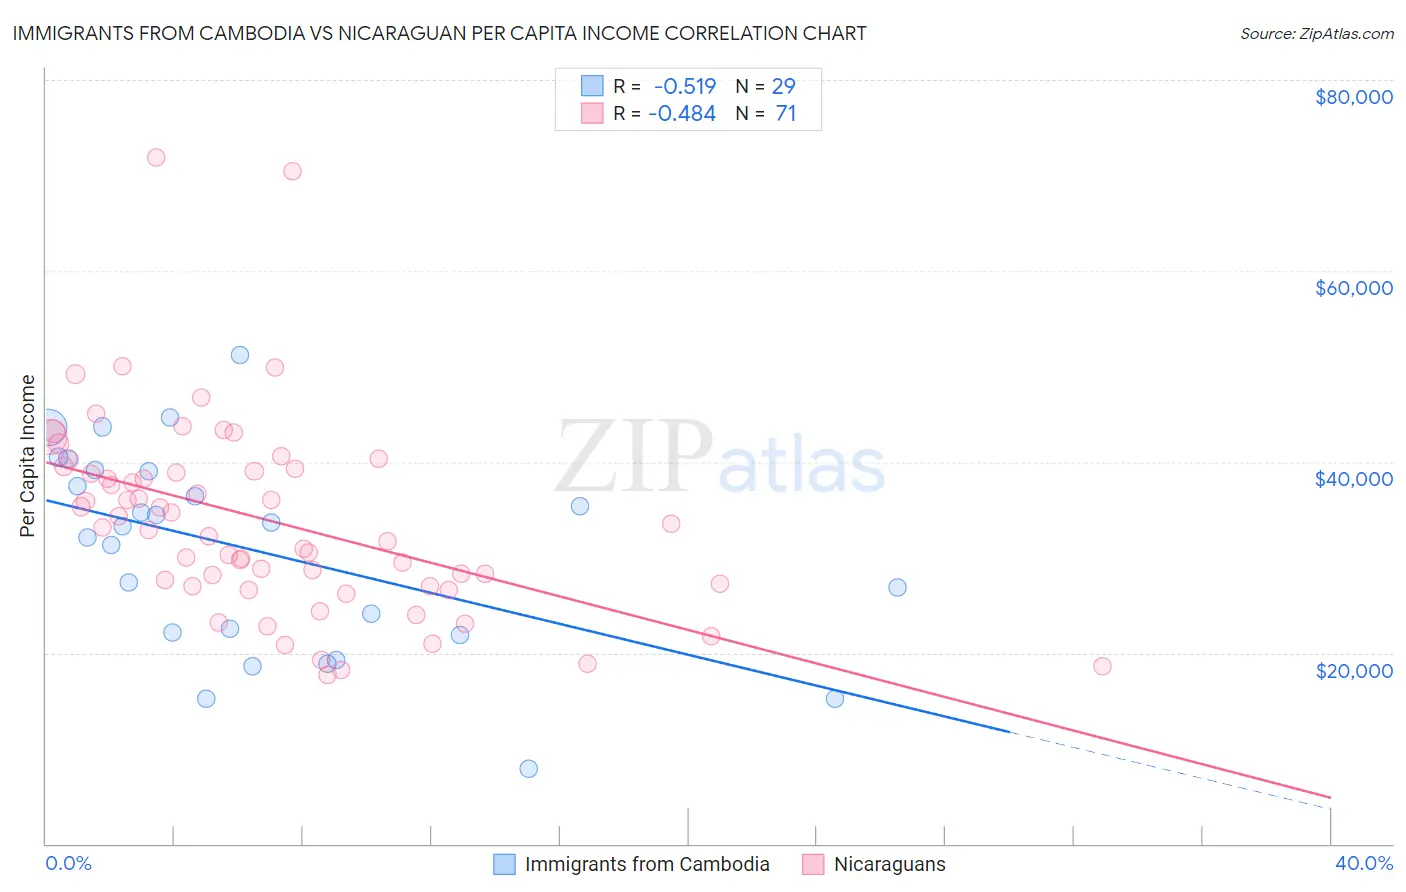
Immigrants from Cambodia vs Nicaraguan Per Capita Income Correlation Chart
The statistical analysis conducted on geographies consisting of 205,159,034 people shows a substantial negative correlation between the proportion of Immigrants from Cambodia and per capita income in the United States with a correlation coefficient (R) of -0.519 and weighted average of $40,434. Similarly, the statistical analysis conducted on geographies consisting of 285,722,062 people shows a moderate negative correlation between the proportion of Nicaraguans and per capita income in the United States with a correlation coefficient (R) of -0.484 and weighted average of $39,372, a difference of 2.7%.
Per Capita Income Correlation Summary
| Measurement | Immigrants from Cambodia | Nicaraguan |
| Minimum | $7,849 | $17,623 |
| Maximum | $51,157 | $71,864 |
| Range | $43,308 | $54,241 |
| Mean | $30,701 | $33,908 |
| Median | $33,314 | $33,140 |
| Interquartile 25% (IQ1) | $21,996 | $27,013 |
| Interquartile 75% (IQ3) | $39,085 | $39,273 |
| Interquartile Range (IQR) | $17,089 | $12,260 |
| Standard Deviation (Sample) | $10,577 | $10,352 |
| Standard Deviation (Population) | $10,393 | $10,279 |
Demographics Similar to Immigrants from Cambodia and Nicaraguans by Per Capita Income
In terms of per capita income, the demographic groups most similar to Immigrants from Cambodia are Somali ($40,367, a difference of 0.16%), Tsimshian ($40,344, a difference of 0.22%), Immigrants from Nigeria ($40,339, a difference of 0.24%), British West Indian ($40,330, a difference of 0.26%), and Immigrants from Western Africa ($40,294, a difference of 0.35%). Similarly, the demographic groups most similar to Nicaraguans are Hawaiian ($39,403, a difference of 0.080%), Immigrants from Middle Africa ($39,529, a difference of 0.40%), Alaska Native ($39,558, a difference of 0.47%), Osage ($39,568, a difference of 0.50%), and Immigrants from the Azores ($39,608, a difference of 0.60%).
| Demographics | Rating | Rank | Per Capita Income |
| Immigrants | Cambodia | 2.6 /100 | #237 | Tragic $40,434 |
| Somalis | 2.4 /100 | #238 | Tragic $40,367 |
| Tsimshian | 2.4 /100 | #239 | Tragic $40,344 |
| Immigrants | Nigeria | 2.3 /100 | #240 | Tragic $40,339 |
| British West Indians | 2.3 /100 | #241 | Tragic $40,330 |
| Immigrants | Western Africa | 2.2 /100 | #242 | Tragic $40,294 |
| German Russians | 2.2 /100 | #243 | Tragic $40,266 |
| French American Indians | 2.1 /100 | #244 | Tragic $40,244 |
| Sub-Saharan Africans | 1.9 /100 | #245 | Tragic $40,152 |
| Cree | 1.7 /100 | #246 | Tragic $40,056 |
| Immigrants | Somalia | 1.6 /100 | #247 | Tragic $39,974 |
| Cape Verdeans | 1.5 /100 | #248 | Tragic $39,935 |
| Japanese | 1.4 /100 | #249 | Tragic $39,870 |
| Immigrants | Burma/Myanmar | 1.3 /100 | #250 | Tragic $39,827 |
| Samoans | 1.3 /100 | #251 | Tragic $39,826 |
| Immigrants | Azores | 1.0 /100 | #252 | Tragic $39,608 |
| Osage | 1.0 /100 | #253 | Tragic $39,568 |
| Alaska Natives | 1.0 /100 | #254 | Tragic $39,558 |
| Immigrants | Middle Africa | 1.0 /100 | #255 | Tragic $39,529 |
| Hawaiians | 0.8 /100 | #256 | Tragic $39,403 |
| Nicaraguans | 0.8 /100 | #257 | Tragic $39,372 |