Immigrants from Cambodia vs Scotch-Irish Per Capita Income
COMPARE
Immigrants from Cambodia
Scotch-Irish
Per Capita Income
Per Capita Income Comparison
Immigrants from Cambodia
Scotch-Irish
$40,434
PER CAPITA INCOME
2.6/ 100
METRIC RATING
237th/ 347
METRIC RANK
$42,563
PER CAPITA INCOME
22.6/ 100
METRIC RATING
197th/ 347
METRIC RANK
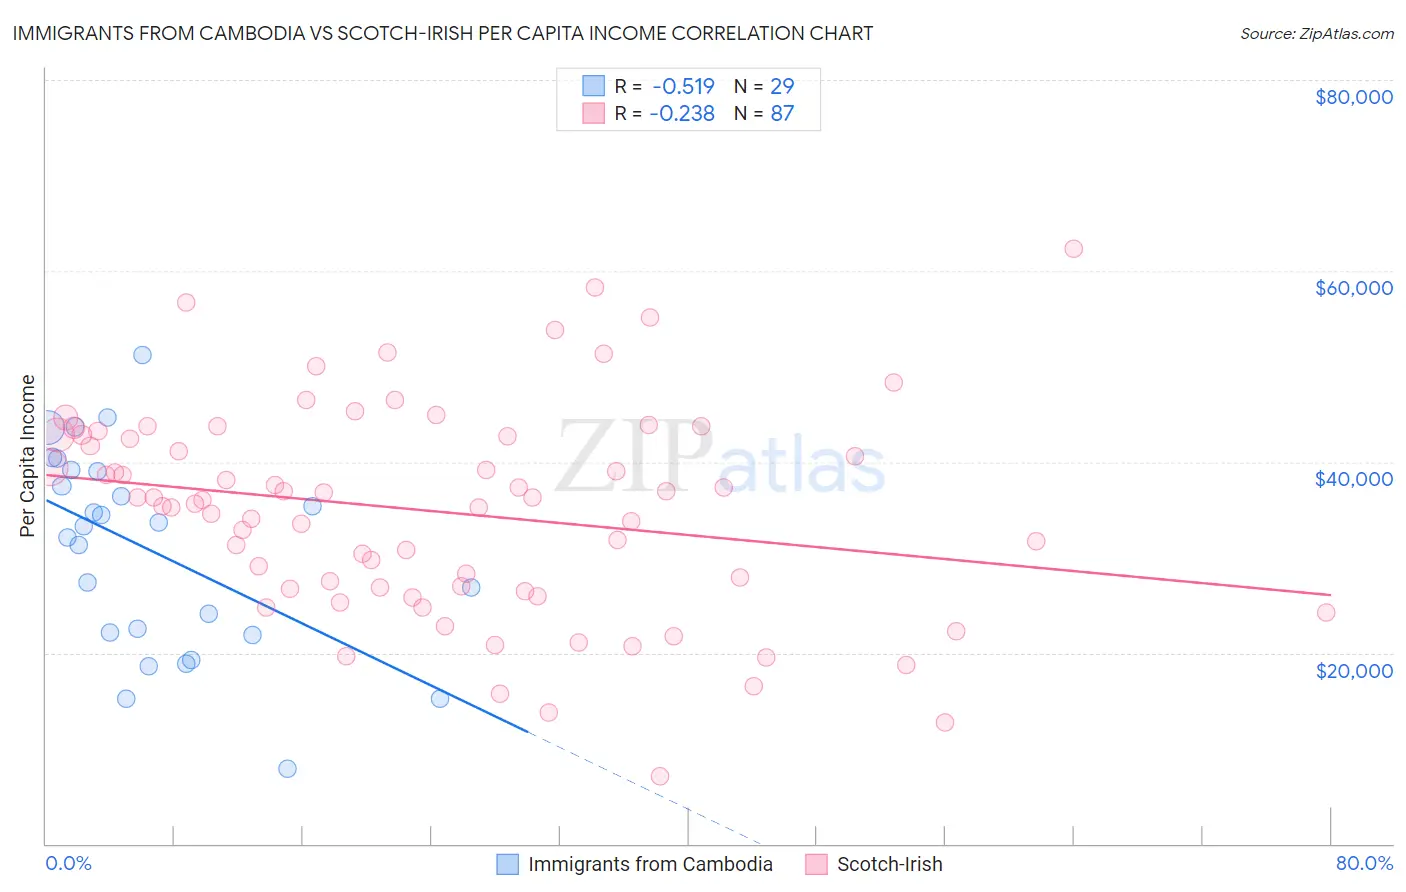
Immigrants from Cambodia vs Scotch-Irish Per Capita Income Correlation Chart
The statistical analysis conducted on geographies consisting of 205,159,034 people shows a substantial negative correlation between the proportion of Immigrants from Cambodia and per capita income in the United States with a correlation coefficient (R) of -0.519 and weighted average of $40,434. Similarly, the statistical analysis conducted on geographies consisting of 548,816,006 people shows a weak negative correlation between the proportion of Scotch-Irish and per capita income in the United States with a correlation coefficient (R) of -0.238 and weighted average of $42,563, a difference of 5.3%.
Per Capita Income Correlation Summary
| Measurement | Immigrants from Cambodia | Scotch-Irish |
| Minimum | $7,849 | $7,124 |
| Maximum | $51,157 | $62,377 |
| Range | $43,308 | $55,253 |
| Mean | $30,701 | $34,830 |
| Median | $33,314 | $35,981 |
| Interquartile 25% (IQ1) | $21,996 | $26,689 |
| Interquartile 75% (IQ3) | $39,085 | $42,802 |
| Interquartile Range (IQR) | $17,089 | $16,113 |
| Standard Deviation (Sample) | $10,577 | $10,987 |
| Standard Deviation (Population) | $10,393 | $10,923 |
Similar Demographics by Per Capita Income
Demographics Similar to Immigrants from Cambodia by Per Capita Income
In terms of per capita income, the demographic groups most similar to Immigrants from Cambodia are Somali ($40,367, a difference of 0.16%), Tsimshian ($40,344, a difference of 0.22%), Immigrants from Nigeria ($40,339, a difference of 0.24%), British West Indian ($40,330, a difference of 0.26%), and Immigrants from Western Africa ($40,294, a difference of 0.35%).
| Demographics | Rating | Rank | Per Capita Income |
| Native Hawaiians | 4.9 /100 | #230 | Tragic $41,017 |
| Senegalese | 4.8 /100 | #231 | Tragic $41,000 |
| Guyanese | 4.5 /100 | #232 | Tragic $40,949 |
| Delaware | 3.8 /100 | #233 | Tragic $40,778 |
| Immigrants | West Indies | 3.7 /100 | #234 | Tragic $40,763 |
| Immigrants | Guyana | 3.6 /100 | #235 | Tragic $40,742 |
| Immigrants | Nonimmigrants | 3.4 /100 | #236 | Tragic $40,669 |
| Immigrants | Cambodia | 2.6 /100 | #237 | Tragic $40,434 |
| Somalis | 2.4 /100 | #238 | Tragic $40,367 |
| Tsimshian | 2.4 /100 | #239 | Tragic $40,344 |
| Immigrants | Nigeria | 2.3 /100 | #240 | Tragic $40,339 |
| British West Indians | 2.3 /100 | #241 | Tragic $40,330 |
| Immigrants | Western Africa | 2.2 /100 | #242 | Tragic $40,294 |
| German Russians | 2.2 /100 | #243 | Tragic $40,266 |
| French American Indians | 2.1 /100 | #244 | Tragic $40,244 |
Demographics Similar to Scotch-Irish by Per Capita Income
In terms of per capita income, the demographic groups most similar to Scotch-Irish are Dutch ($42,605, a difference of 0.10%), Immigrants from Kenya ($42,661, a difference of 0.23%), Immigrants from Fiji ($42,694, a difference of 0.31%), Immigrants from Portugal ($42,412, a difference of 0.36%), and Barbadian ($42,406, a difference of 0.37%).
| Demographics | Rating | Rank | Per Capita Income |
| Kenyans | 27.7 /100 | #190 | Fair $42,808 |
| Yugoslavians | 27.4 /100 | #191 | Fair $42,792 |
| Iraqis | 26.7 /100 | #192 | Fair $42,760 |
| Immigrants | Sierra Leone | 26.5 /100 | #193 | Fair $42,752 |
| Immigrants | Fiji | 25.2 /100 | #194 | Fair $42,694 |
| Immigrants | Kenya | 24.5 /100 | #195 | Fair $42,661 |
| Dutch | 23.4 /100 | #196 | Fair $42,605 |
| Scotch-Irish | 22.6 /100 | #197 | Fair $42,563 |
| Immigrants | Portugal | 19.7 /100 | #198 | Poor $42,412 |
| Barbadians | 19.6 /100 | #199 | Poor $42,406 |
| Vietnamese | 19.0 /100 | #200 | Poor $42,368 |
| Immigrants | Thailand | 17.6 /100 | #201 | Poor $42,289 |
| Immigrants | Bosnia and Herzegovina | 17.5 /100 | #202 | Poor $42,278 |
| Spanish | 17.0 /100 | #203 | Poor $42,249 |
| Aleuts | 16.4 /100 | #204 | Poor $42,210 |