Immigrants from Cambodia vs Nigerian Householder Income Over 65 years
COMPARE
Immigrants from Cambodia
Nigerian
Householder Income Over 65 years
Householder Income Over 65 years Comparison
Immigrants from Cambodia
Nigerians
$57,580
HOUSEHOLDER INCOME OVER 65 YEARS
2.8/ 100
METRIC RATING
230th/ 347
METRIC RANK
$58,992
HOUSEHOLDER INCOME OVER 65 YEARS
11.2/ 100
METRIC RATING
210th/ 347
METRIC RANK
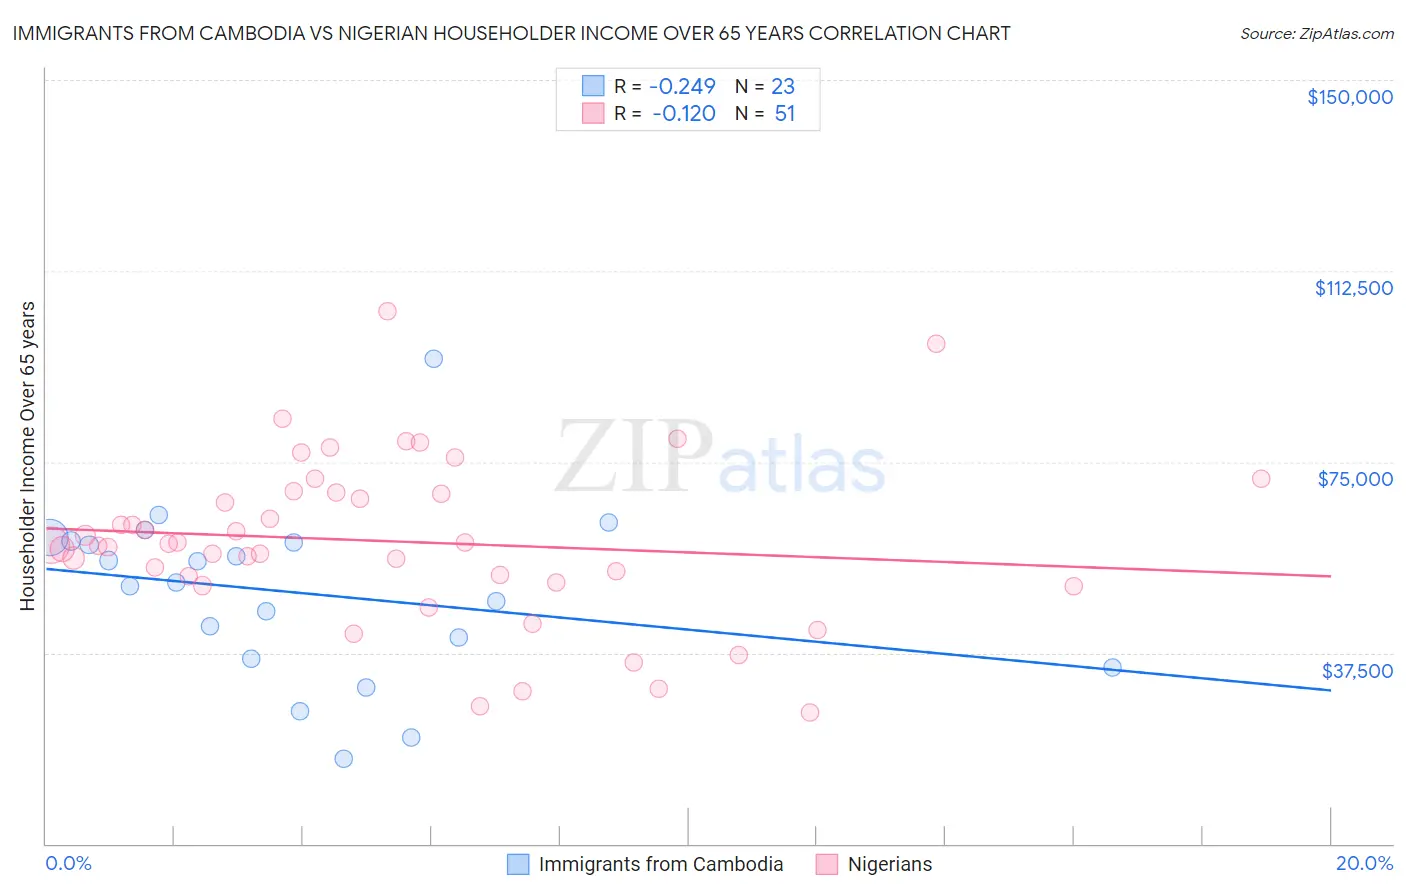
Immigrants from Cambodia vs Nigerian Householder Income Over 65 years Correlation Chart
The statistical analysis conducted on geographies consisting of 204,993,157 people shows a weak negative correlation between the proportion of Immigrants from Cambodia and household income with householder over the age of 65 in the United States with a correlation coefficient (R) of -0.249 and weighted average of $57,580. Similarly, the statistical analysis conducted on geographies consisting of 331,517,190 people shows a poor negative correlation between the proportion of Nigerians and household income with householder over the age of 65 in the United States with a correlation coefficient (R) of -0.120 and weighted average of $58,992, a difference of 2.5%.
Householder Income Over 65 years Correlation Summary
| Measurement | Immigrants from Cambodia | Nigerian |
| Minimum | $16,632 | $25,694 |
| Maximum | $95,250 | $104,625 |
| Range | $78,618 | $78,931 |
| Mean | $49,242 | $59,394 |
| Median | $51,420 | $58,564 |
| Interquartile 25% (IQ1) | $36,323 | $51,335 |
| Interquartile 75% (IQ3) | $59,381 | $68,991 |
| Interquartile Range (IQR) | $23,058 | $17,656 |
| Standard Deviation (Sample) | $17,189 | $16,370 |
| Standard Deviation (Population) | $16,811 | $16,209 |
Demographics Similar to Immigrants from Cambodia and Nigerians by Householder Income Over 65 years
In terms of householder income over 65 years, the demographic groups most similar to Immigrants from Cambodia are Immigrants from Colombia ($57,658, a difference of 0.14%), Immigrants from Albania ($57,828, a difference of 0.43%), Japanese ($57,919, a difference of 0.59%), French Canadian ($57,975, a difference of 0.69%), and Venezuelan ($58,026, a difference of 0.77%). Similarly, the demographic groups most similar to Nigerians are Immigrants from Nigeria ($58,942, a difference of 0.090%), Colombian ($58,851, a difference of 0.24%), White/Caucasian ($58,847, a difference of 0.25%), Nepalese ($58,761, a difference of 0.39%), and Immigrants from Ghana ($58,624, a difference of 0.63%).
| Demographics | Rating | Rank | Householder Income Over 65 years |
| Nigerians | 11.2 /100 | #210 | Poor $58,992 |
| Immigrants | Nigeria | 10.7 /100 | #211 | Poor $58,942 |
| Colombians | 9.8 /100 | #212 | Tragic $58,851 |
| Whites/Caucasians | 9.8 /100 | #213 | Tragic $58,847 |
| Nepalese | 9.0 /100 | #214 | Tragic $58,761 |
| Immigrants | Ghana | 7.9 /100 | #215 | Tragic $58,624 |
| Immigrants | Middle Africa | 6.2 /100 | #216 | Tragic $58,375 |
| Sudanese | 5.7 /100 | #217 | Tragic $58,281 |
| Panamanians | 5.6 /100 | #218 | Tragic $58,266 |
| Malaysians | 5.5 /100 | #219 | Tragic $58,244 |
| Yugoslavians | 5.5 /100 | #220 | Tragic $58,243 |
| Immigrants | El Salvador | 5.4 /100 | #221 | Tragic $58,226 |
| Delaware | 5.3 /100 | #222 | Tragic $58,214 |
| Tsimshian | 5.2 /100 | #223 | Tragic $58,202 |
| Bermudans | 5.1 /100 | #224 | Tragic $58,171 |
| Venezuelans | 4.4 /100 | #225 | Tragic $58,026 |
| French Canadians | 4.2 /100 | #226 | Tragic $57,975 |
| Japanese | 3.9 /100 | #227 | Tragic $57,919 |
| Immigrants | Albania | 3.6 /100 | #228 | Tragic $57,828 |
| Immigrants | Colombia | 3.0 /100 | #229 | Tragic $57,658 |
| Immigrants | Cambodia | 2.8 /100 | #230 | Tragic $57,580 |