Arab vs Nigerian Median Male Earnings
COMPARE
Arab
Nigerian
Median Male Earnings
Median Male Earnings Comparison
Arabs
Nigerians
$57,298
MEDIAN MALE EARNINGS
94.0/ 100
METRIC RATING
119th/ 347
METRIC RANK
$52,039
MEDIAN MALE EARNINGS
8.3/ 100
METRIC RATING
217th/ 347
METRIC RANK
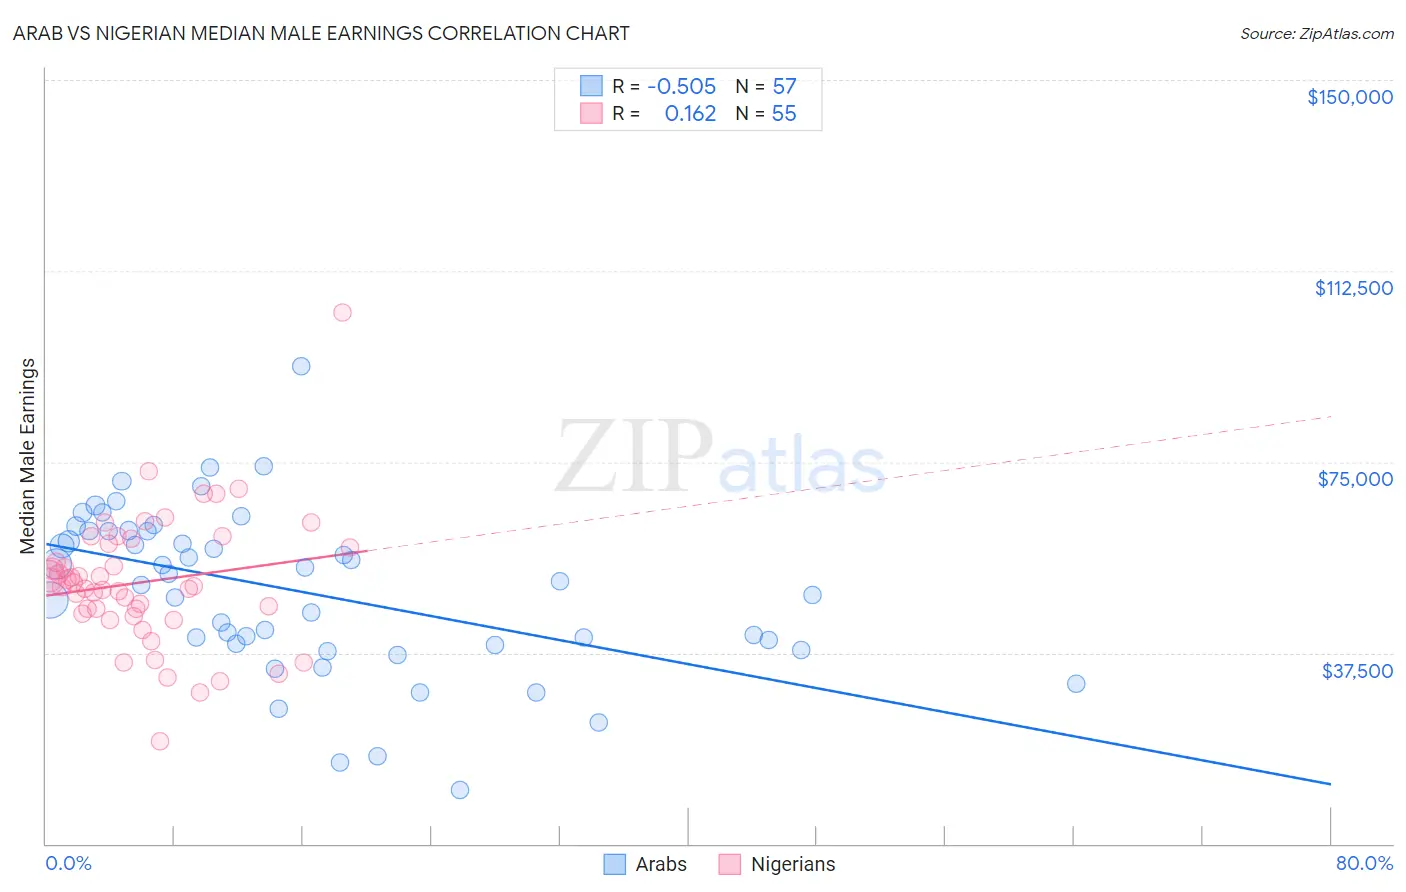
Arab vs Nigerian Median Male Earnings Correlation Chart
The statistical analysis conducted on geographies consisting of 486,638,501 people shows a substantial negative correlation between the proportion of Arabs and median male earnings in the United States with a correlation coefficient (R) of -0.505 and weighted average of $57,298. Similarly, the statistical analysis conducted on geographies consisting of 332,727,024 people shows a poor positive correlation between the proportion of Nigerians and median male earnings in the United States with a correlation coefficient (R) of 0.162 and weighted average of $52,039, a difference of 10.1%.
Median Male Earnings Correlation Summary
| Measurement | Arab | Nigerian |
| Minimum | $10,662 | $20,187 |
| Maximum | $93,845 | $104,375 |
| Range | $83,183 | $84,188 |
| Mean | $49,636 | $51,399 |
| Median | $51,622 | $50,552 |
| Interquartile 25% (IQ1) | $39,178 | $45,099 |
| Interquartile 75% (IQ3) | $61,412 | $58,900 |
| Interquartile Range (IQR) | $22,233 | $13,801 |
| Standard Deviation (Sample) | $16,136 | $12,955 |
| Standard Deviation (Population) | $15,994 | $12,837 |
Similar Demographics by Median Male Earnings
Demographics Similar to Arabs by Median Male Earnings
In terms of median male earnings, the demographic groups most similar to Arabs are Hungarian ($57,309, a difference of 0.020%), Canadian ($57,286, a difference of 0.020%), Immigrants from Zimbabwe ($57,352, a difference of 0.090%), Lebanese ($57,409, a difference of 0.19%), and Immigrants from Albania ($57,179, a difference of 0.21%).
| Demographics | Rating | Rank | Median Male Earnings |
| Immigrants | Afghanistan | 95.4 /100 | #112 | Exceptional $57,582 |
| Carpatho Rusyns | 95.3 /100 | #113 | Exceptional $57,572 |
| Immigrants | Kuwait | 95.3 /100 | #114 | Exceptional $57,562 |
| Swedes | 94.8 /100 | #115 | Exceptional $57,445 |
| Lebanese | 94.6 /100 | #116 | Exceptional $57,409 |
| Immigrants | Zimbabwe | 94.3 /100 | #117 | Exceptional $57,352 |
| Hungarians | 94.0 /100 | #118 | Exceptional $57,309 |
| Arabs | 94.0 /100 | #119 | Exceptional $57,298 |
| Canadians | 93.9 /100 | #120 | Exceptional $57,286 |
| Immigrants | Albania | 93.3 /100 | #121 | Exceptional $57,179 |
| Immigrants | Jordan | 93.1 /100 | #122 | Exceptional $57,145 |
| Slovenes | 93.1 /100 | #123 | Exceptional $57,145 |
| Chileans | 91.9 /100 | #124 | Exceptional $56,973 |
| Immigrants | Morocco | 91.8 /100 | #125 | Exceptional $56,958 |
| Chinese | 91.1 /100 | #126 | Exceptional $56,872 |
Demographics Similar to Nigerians by Median Male Earnings
In terms of median male earnings, the demographic groups most similar to Nigerians are Immigrants from Venezuela ($52,041, a difference of 0.0%), Immigrants from Cameroon ($52,119, a difference of 0.15%), Immigrants from Panama ($51,962, a difference of 0.15%), Nonimmigrants ($52,170, a difference of 0.25%), and Immigrants from Ghana ($51,836, a difference of 0.39%).
| Demographics | Rating | Rank | Median Male Earnings |
| Delaware | 11.5 /100 | #210 | Poor $52,412 |
| Tlingit-Haida | 11.5 /100 | #211 | Poor $52,409 |
| Cajuns | 10.7 /100 | #212 | Poor $52,325 |
| Native Hawaiians | 10.5 /100 | #213 | Poor $52,306 |
| Immigrants | Nonimmigrants | 9.3 /100 | #214 | Tragic $52,170 |
| Immigrants | Cameroon | 8.9 /100 | #215 | Tragic $52,119 |
| Immigrants | Venezuela | 8.3 /100 | #216 | Tragic $52,041 |
| Nigerians | 8.3 /100 | #217 | Tragic $52,039 |
| Immigrants | Panama | 7.7 /100 | #218 | Tragic $51,962 |
| Immigrants | Ghana | 6.9 /100 | #219 | Tragic $51,836 |
| Immigrants | Armenia | 6.6 /100 | #220 | Tragic $51,793 |
| Immigrants | Senegal | 5.8 /100 | #221 | Tragic $51,647 |
| Immigrants | Bangladesh | 5.8 /100 | #222 | Tragic $51,642 |
| Ecuadorians | 5.5 /100 | #223 | Tragic $51,596 |
| Immigrants | Cambodia | 5.5 /100 | #224 | Tragic $51,594 |