Immigrants from Cambodia vs Nigerian Unemployment Among Women with Children Under 6 years

COMPARE

Immigrants from Cambodia
Race
Ancestry
AfghanAfricanAlaska NativeAlaskan AthabascanAlbanianAleutAlsatianAmericanApacheArabArapahoArgentineanArmenianAssyrian/Chaldean/SyriacAustralianAustrianBahamianBangladeshiBarbadianBasqueBelgianBelizeanBermudanBhutaneseBlackfeetBolivianBrazilianBritishBritish West IndianBulgarianBurmeseCajunCambodianCanadianCape VerdeanCarpatho RusynCelticCentral AmericanCentral American IndianCherokeeCheyenneChickasawChileanChineseChippewaChoctawColombianColvilleComancheCosta RicanCreeCreekCroatianCrowCubanCypriotCzechCzechoslovakianDanishDelawareDominicanDutchDutch West IndianEastern EuropeanEcuadorianEgyptianEnglishEstonianEthiopianEuropeanFijianFilipinoFinnishFrenchFrench American IndianFrench CanadianGermanGerman RussianGhanaianGreekGuamanian/ChamorroGuatemalanGuyaneseHaitianHmongHonduranHopiHoumaHungarianIcelanderIndian (Asian)IndonesianInupiatIranianIraqiIrishIroquoisIsraeliItalianJamaicanJapaneseJordanianKenyanKiowaKoreanLaotianLatvianLebaneseLiberianLithuanianLumbeeLuxembourgerMacedonianMalaysianMalteseMarshalleseMenomineeMexicanMexican American IndianMongolianMoroccanNative HawaiianNavajoNepaleseNew ZealanderNicaraguanNorthern EuropeanNorwegianOkinawanOsageOttawaPaiutePakistaniPalestinianPanamanianParaguayanPennsylvania GermanPeruvianPimaPolishPortuguesePotawatomiPuebloPuerto RicanPuget Sound SalishRomanianRussianSalvadoranSamoanScandinavianScotch-IrishScottishSeminoleSenegaleseSerbianShoshoneSierra LeoneanSiouxSlavicSlovakSloveneSomaliSouth AfricanSouth AmericanSouth American IndianSoviet UnionSpaniardSpanishSpanish AmericanSpanish American IndianSri LankanSubsaharan AfricanSudaneseSwedishSwissSyrianTaiwaneseThaiTlingit-HaidaTohono O'OdhamTonganTrinidadian and TobagonianTsimshianTurkishU.S. Virgin IslanderUgandanUkrainianUruguayanUteVenezuelanVietnameseWelshWest IndianYakamaYaquiYugoslavianYumanYup'ikZimbabwean
Immigration
NonimmigrantsImmigrantsAfghanistanAfricaAlbaniaArgentinaArmeniaAsiaAustraliaAustriaBahamasBangladeshBarbadosBelarusBelgiumBelizeBoliviaBosnia and HerzegovinaBrazilBulgariaBurma/MyanmarCabo VerdeCambodiaCameroonCanadaCaribbeanCentral AmericaChileChinaColombiaCongoCosta RicaCroatiaCubaCzechoslovakiaDenmarkDominicaDominican RepublicEastern AfricaEastern AsiaEastern EuropeEcuadorEgyptEl SalvadorEnglandEritreaEthiopiaEuropeFijiFranceGermanyGhanaGreeceGrenadaGuatemalaGuyanaHaitiHondurasHong KongHungaryIndiaIndonesiaIranIraqIrelandIsraelItalyJamaicaJapanJordanKazakhstanKenyaKoreaKuwaitLaosLatin AmericaLatviaLebanonLiberiaLithuaniaMalaysiaMexicoMicronesiaMiddle AfricaMoldovaMoroccoNepalNetherlandsNicaraguaNigeriaNorth AmericaNorth MacedoniaNorthern AfricaNorthern EuropeNorwayOceaniaPakistanPanamaPeruPhilippinesPolandPortugalRomaniaRussiaSaudi ArabiaScotlandSenegalSerbiaSierra LeoneSingaporeSomaliaSouth AfricaSouth AmericaSouth Central AsiaSouth Eastern AsiaSouthern EuropeSpainSri LankaSt. Vincent and the GrenadinesSudanSwedenSwitzerlandSyriaTaiwanThailandTrinidad and TobagoTurkeyUgandaUkraineUruguayUzbekistanVenezuelaVietnamWest IndiesWestern AfricaWestern AsiaWestern EuropeYemenZaireZimbabweAzores
Nigerian
Race
Ancestry
AfghanAfricanAlaska NativeAlaskan AthabascanAlbanianAleutAlsatianAmericanApacheArabArapahoArgentineanArmenianAssyrian/Chaldean/SyriacAustralianAustrianBahamianBangladeshiBarbadianBasqueBelgianBelizeanBermudanBhutaneseBlackfeetBolivianBrazilianBritishBritish West IndianBulgarianBurmeseCajunCambodianCanadianCape VerdeanCarpatho RusynCelticCentral AmericanCentral American IndianCherokeeCheyenneChickasawChileanChineseChippewaChoctawColombianColvilleComancheCosta RicanCreeCreekCroatianCrowCubanCypriotCzechCzechoslovakianDanishDelawareDominicanDutchDutch West IndianEastern EuropeanEcuadorianEgyptianEnglishEstonianEthiopianEuropeanFijianFilipinoFinnishFrenchFrench American IndianFrench CanadianGermanGerman RussianGhanaianGreekGuamanian/ChamorroGuatemalanGuyaneseHaitianHmongHonduranHopiHoumaHungarianIcelanderIndian (Asian)IndonesianInupiatIranianIraqiIrishIroquoisIsraeliItalianJamaicanJapaneseJordanianKenyanKiowaKoreanLaotianLatvianLebaneseLiberianLithuanianLumbeeLuxembourgerMacedonianMalaysianMalteseMarshalleseMenomineeMexicanMexican American IndianMongolianMoroccanNative HawaiianNavajoNepaleseNew ZealanderNicaraguanNigerianNorthern EuropeanNorwegianOkinawanOsageOttawaPaiutePakistaniPalestinianPanamanianParaguayanPennsylvania GermanPeruvianPimaPolishPortuguesePotawatomiPuebloPuerto RicanPuget Sound SalishRomanianRussianSalvadoranSamoanScandinavianScotch-IrishScottishSeminoleSenegaleseSerbianShoshoneSierra LeoneanSiouxSlavicSlovakSloveneSomaliSouth AfricanSouth AmericanSouth American IndianSoviet UnionSpaniardSpanishSpanish AmericanSpanish American IndianSri LankanSubsaharan AfricanSudaneseSwedishSwissSyrianTaiwaneseThaiTlingit-HaidaTohono O'OdhamTonganTrinidadian and TobagonianTsimshianTurkishU.S. Virgin IslanderUgandanUkrainianUruguayanUteVenezuelanVietnameseWelshWest IndianYakamaYaquiYugoslavianYumanYup'ikZimbabwean
Immigration
NonimmigrantsImmigrantsAfghanistanAfricaAlbaniaArgentinaArmeniaAsiaAustraliaAustriaBahamasBangladeshBarbadosBelarusBelgiumBelizeBoliviaBosnia and HerzegovinaBrazilBulgariaBurma/MyanmarCabo VerdeCameroonCanadaCaribbeanCentral AmericaChileChinaColombiaCongoCosta RicaCroatiaCubaCzechoslovakiaDenmarkDominicaDominican RepublicEastern AfricaEastern AsiaEastern EuropeEcuadorEgyptEl SalvadorEnglandEritreaEthiopiaEuropeFijiFranceGermanyGhanaGreeceGrenadaGuatemalaGuyanaHaitiHondurasHong KongHungaryIndiaIndonesiaIranIraqIrelandIsraelItalyJamaicaJapanJordanKazakhstanKenyaKoreaKuwaitLaosLatin AmericaLatviaLebanonLiberiaLithuaniaMalaysiaMexicoMicronesiaMiddle AfricaMoldovaMoroccoNepalNetherlandsNicaraguaNigeriaNorth AmericaNorth MacedoniaNorthern AfricaNorthern EuropeNorwayOceaniaPakistanPanamaPeruPhilippinesPolandPortugalRomaniaRussiaSaudi ArabiaScotlandSenegalSerbiaSierra LeoneSingaporeSomaliaSouth AfricaSouth AmericaSouth Central AsiaSouth Eastern AsiaSouthern EuropeSpainSri LankaSt. Vincent and the GrenadinesSudanSwedenSwitzerlandSyriaTaiwanThailandTrinidad and TobagoTurkeyUgandaUkraineUruguayUzbekistanVenezuelaVietnamWest IndiesWestern AfricaWestern AsiaWestern EuropeYemenZaireZimbabweAzores
Unemployment Among Women with Children Under 6 years
Income
Poverty
Unemployment
Labor Participation
Family Structure
Vehicle Availability
Education Level
Disability

Unemployment Among Women with Children Under 6 years Comparison

Immigrants from Cambodia

Nigerians

Excellent
Tragic
7.4%
UNEMPLOYMENT AMONG WOMEN WITH CHILDREN UNDER 6 YEARS
84.6/ 100
METRIC RATING
137th/ 347
METRIC RANK
8.2%
UNEMPLOYMENT AMONG WOMEN WITH CHILDREN UNDER 6 YEARS
1.1/ 100
METRIC RATING
250th/ 347
METRIC RANK

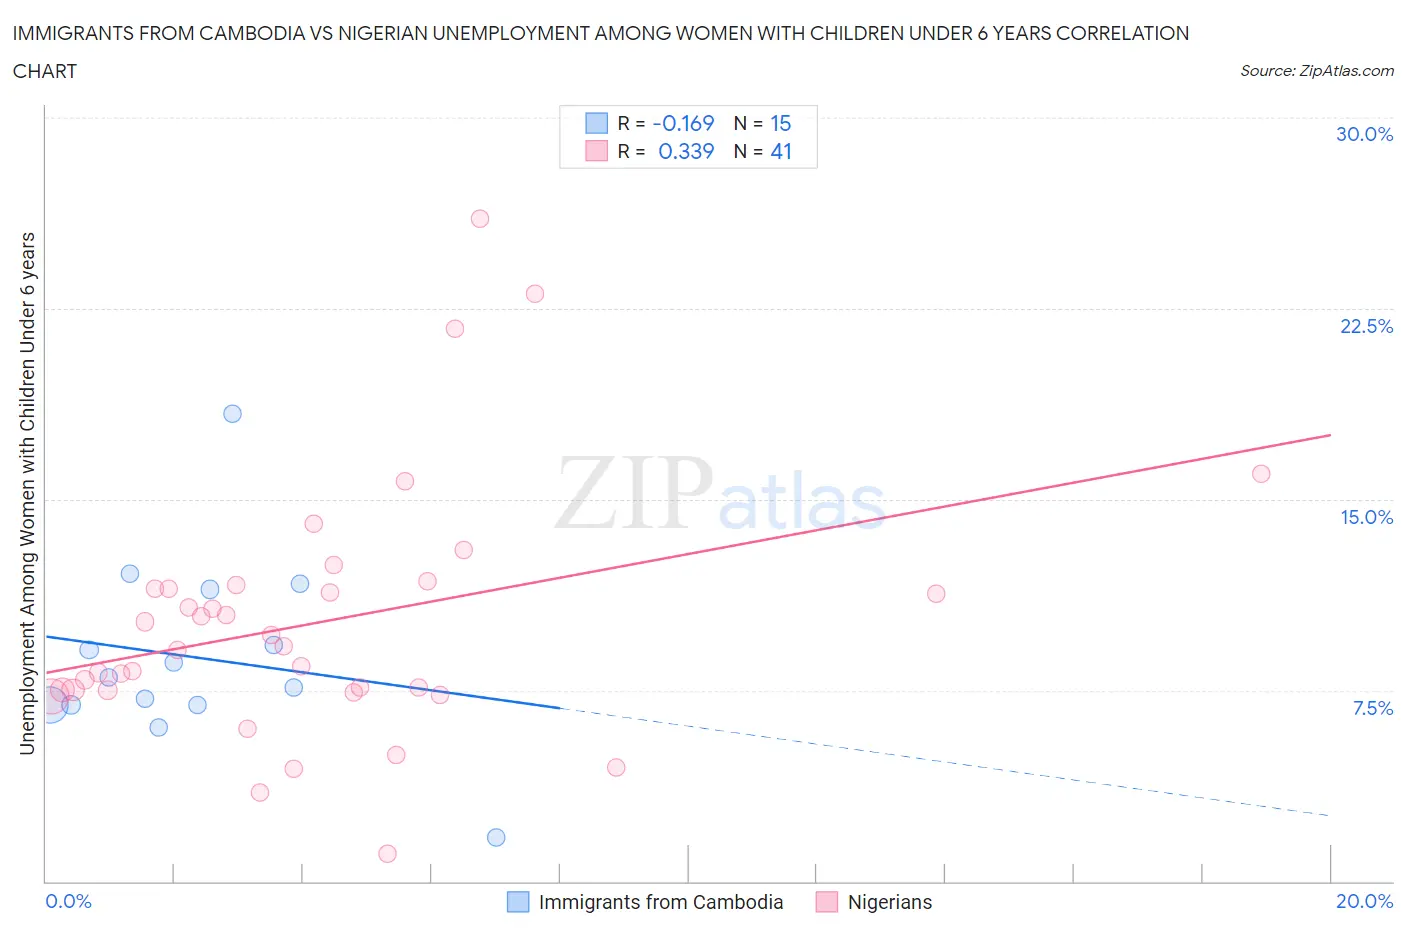
Immigrants from Cambodia vs Nigerian Unemployment Among Women with Children Under 6 years Correlation Chart

The statistical analysis conducted on geographies consisting of 176,492,322 people shows a poor negative correlation between the proportion of Immigrants from Cambodia and unemployment rate among women with children under the age of 6 in the United States with a correlation coefficient (R) of -0.169 and weighted average of 7.4%. Similarly, the statistical analysis conducted on geographies consisting of 269,613,333 people shows a mild positive correlation between the proportion of Nigerians and unemployment rate among women with children under the age of 6 in the United States with a correlation coefficient (R) of 0.339 and weighted average of 8.2%, a difference of 10.6%.
Immigrants from Cambodia vs Nigerian Unemployment Among Women with Children Under 6 years

Unemployment Among Women with Children Under 6 years Correlation Summary

MeasurementImmigrants from CambodiaNigerian
Minimum1.7%1.1%
Maximum18.4%26.0%
Range16.7%24.9%
Mean8.8%10.2%
Median8.0%9.2%
Interquartile 25% (IQ1)6.9%7.5%
Interquartile 75% (IQ3)11.5%11.6%
Interquartile Range (IQR)4.5%4.1%
Standard Deviation (Sample)3.7%4.9%
Standard Deviation (Population)3.6%4.9%

Similar Demographics by Unemployment Among Women with Children Under 6 years

Demographics Similar to Immigrants from Cambodia by Unemployment Among Women with Children Under 6 years

In terms of unemployment among women with children under 6 years, the demographic groups most similar to Immigrants from Cambodia are Immigrants from Morocco (7.4%, a difference of 0.030%), Immigrants from Norway (7.4%, a difference of 0.070%), Immigrants from Northern Africa (7.4%, a difference of 0.090%), Immigrants from Colombia (7.4%, a difference of 0.090%), and Immigrants from Bolivia (7.4%, a difference of 0.15%).
DemographicsRating | RankUnemployment Among Women with Children Under 6 years
Swedes
88.4
/100
|
#130
Excellent
7.4%
Ukrainians
88.2
/100
|
#131
Excellent
7.4%
Immigrants | Armenia
87.4
/100
|
#132
Excellent
7.4%
Immigrants | Uganda
86.5
/100
|
#133
Excellent
7.4%
Immigrants | Bolivia
85.7
/100
|
#134
Excellent
7.4%
Immigrants | Northern Africa
85.3
/100
|
#135
Excellent
7.4%
Immigrants | Morocco
84.9
/100
|
#136
Excellent
7.4%
Immigrants | Cambodia
84.6
/100
|
#137
Excellent
7.4%
Immigrants | Norway
84.1
/100
|
#138
Excellent
7.4%
Immigrants | Colombia
83.9
/100
|
#139
Excellent
7.4%
Scandinavians
83.0
/100
|
#140
Excellent
7.4%
Greeks
82.6
/100
|
#141
Excellent
7.4%
Immigrants | Argentina
81.5
/100
|
#142
Excellent
7.5%
Koreans
81.3
/100
|
#143
Excellent
7.5%
Europeans
79.1
/100
|
#144
Good
7.5%

Demographics Similar to Nigerians by Unemployment Among Women with Children Under 6 years

In terms of unemployment among women with children under 6 years, the demographic groups most similar to Nigerians are Immigrants from Sierra Leone (8.2%, a difference of 0.010%), Immigrants from Western Africa (8.2%, a difference of 0.10%), German Russian (8.2%, a difference of 0.14%), Guyanese (8.2%, a difference of 0.17%), and Ghanaian (8.2%, a difference of 0.17%).
DemographicsRating | RankUnemployment Among Women with Children Under 6 years
Hawaiians
1.8
/100
|
#243
Tragic
8.2%
French
1.7
/100
|
#244
Tragic
8.2%
Native Hawaiians
1.7
/100
|
#245
Tragic
8.2%
Central Americans
1.4
/100
|
#246
Tragic
8.2%
German Russians
1.2
/100
|
#247
Tragic
8.2%
Immigrants | Western Africa
1.1
/100
|
#248
Tragic
8.2%
Immigrants | Sierra Leone
1.1
/100
|
#249
Tragic
8.2%
Nigerians
1.1
/100
|
#250
Tragic
8.2%
Guyanese
1.0
/100
|
#251
Tragic
8.2%
Ghanaians
1.0
/100
|
#252
Tragic
8.2%
Immigrants | Guyana
0.8
/100
|
#253
Tragic
8.2%
Immigrants | Caribbean
0.7
/100
|
#254
Tragic
8.3%
Immigrants | Portugal
0.6
/100
|
#255
Tragic
8.3%
Celtics
0.6
/100
|
#256
Tragic
8.3%
British West Indians
0.5
/100
|
#257
Tragic
8.3%