Immigrants from Russia vs Crow Median Earnings
COMPARE
Immigrants from Russia
Crow
Median Earnings
Median Earnings Comparison
Immigrants from Russia
Crow
$53,457
MEDIAN EARNINGS
100.0/ 100
METRIC RATING
29th/ 347
METRIC RANK
$38,707
MEDIAN EARNINGS
0.0/ 100
METRIC RATING
336th/ 347
METRIC RANK
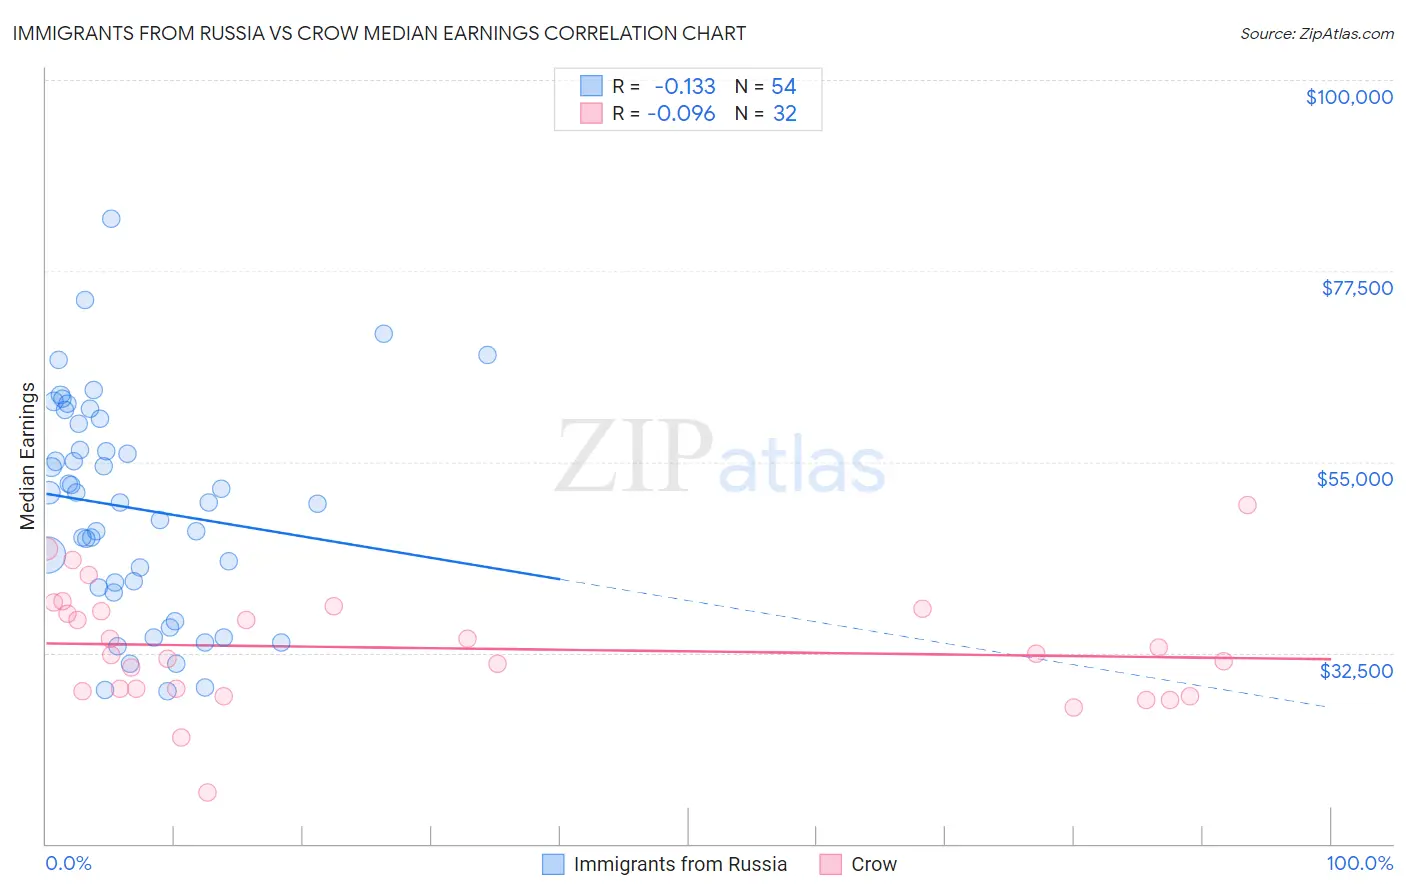
Immigrants from Russia vs Crow Median Earnings Correlation Chart
The statistical analysis conducted on geographies consisting of 347,936,772 people shows a poor negative correlation between the proportion of Immigrants from Russia and median earnings in the United States with a correlation coefficient (R) of -0.133 and weighted average of $53,457. Similarly, the statistical analysis conducted on geographies consisting of 59,204,148 people shows a slight negative correlation between the proportion of Crow and median earnings in the United States with a correlation coefficient (R) of -0.096 and weighted average of $38,707, a difference of 38.1%.
Median Earnings Correlation Summary
| Measurement | Immigrants from Russia | Crow |
| Minimum | $27,990 | $16,094 |
| Maximum | $83,702 | $49,926 |
| Range | $55,712 | $33,832 |
| Mean | $49,525 | $33,045 |
| Median | $50,229 | $32,361 |
| Interquartile 25% (IQ1) | $40,169 | $28,093 |
| Interquartile 75% (IQ3) | $59,535 | $37,549 |
| Interquartile Range (IQR) | $19,366 | $9,456 |
| Standard Deviation (Sample) | $12,722 | $6,875 |
| Standard Deviation (Population) | $12,603 | $6,767 |
Similar Demographics by Median Earnings
Demographics Similar to Immigrants from Russia by Median Earnings
In terms of median earnings, the demographic groups most similar to Immigrants from Russia are Immigrants from France ($53,490, a difference of 0.060%), Cambodian ($53,386, a difference of 0.13%), Russian ($53,334, a difference of 0.23%), Immigrants from Asia ($53,310, a difference of 0.28%), and Immigrants from Greece ($53,282, a difference of 0.33%).
| Demographics | Rating | Rank | Median Earnings |
| Immigrants | Korea | 100.0 /100 | #22 | Exceptional $54,530 |
| Immigrants | Sweden | 100.0 /100 | #23 | Exceptional $54,478 |
| Soviet Union | 100.0 /100 | #24 | Exceptional $54,290 |
| Turks | 100.0 /100 | #25 | Exceptional $53,919 |
| Immigrants | Northern Europe | 100.0 /100 | #26 | Exceptional $53,872 |
| Asians | 100.0 /100 | #27 | Exceptional $53,690 |
| Immigrants | France | 100.0 /100 | #28 | Exceptional $53,490 |
| Immigrants | Russia | 100.0 /100 | #29 | Exceptional $53,457 |
| Cambodians | 100.0 /100 | #30 | Exceptional $53,386 |
| Russians | 100.0 /100 | #31 | Exceptional $53,334 |
| Immigrants | Asia | 100.0 /100 | #32 | Exceptional $53,310 |
| Immigrants | Greece | 100.0 /100 | #33 | Exceptional $53,282 |
| Immigrants | Sri Lanka | 100.0 /100 | #34 | Exceptional $53,268 |
| Immigrants | Switzerland | 100.0 /100 | #35 | Exceptional $53,211 |
| Immigrants | Denmark | 100.0 /100 | #36 | Exceptional $53,186 |
Demographics Similar to Crow by Median Earnings
In terms of median earnings, the demographic groups most similar to Crow are Native/Alaskan ($38,896, a difference of 0.49%), Spanish American Indian ($38,907, a difference of 0.52%), Houma ($38,949, a difference of 0.62%), Immigrants from Cuba ($38,426, a difference of 0.73%), and Yakama ($39,107, a difference of 1.0%).
| Demographics | Rating | Rank | Median Earnings |
| Kiowa | 0.0 /100 | #329 | Tragic $39,232 |
| Immigrants | Congo | 0.0 /100 | #330 | Tragic $39,169 |
| Immigrants | Mexico | 0.0 /100 | #331 | Tragic $39,114 |
| Yakama | 0.0 /100 | #332 | Tragic $39,107 |
| Houma | 0.0 /100 | #333 | Tragic $38,949 |
| Spanish American Indians | 0.0 /100 | #334 | Tragic $38,907 |
| Natives/Alaskans | 0.0 /100 | #335 | Tragic $38,896 |
| Crow | 0.0 /100 | #336 | Tragic $38,707 |
| Immigrants | Cuba | 0.0 /100 | #337 | Tragic $38,426 |
| Pima | 0.0 /100 | #338 | Tragic $38,285 |
| Menominee | 0.0 /100 | #339 | Tragic $37,884 |
| Navajo | 0.0 /100 | #340 | Tragic $36,999 |
| Lumbee | 0.0 /100 | #341 | Tragic $36,876 |
| Hopi | 0.0 /100 | #342 | Tragic $36,871 |
| Pueblo | 0.0 /100 | #343 | Tragic $36,859 |