Immigrants from Belarus vs Crow Median Earnings
COMPARE
Immigrants from Belarus
Crow
Median Earnings
Median Earnings Comparison
Immigrants from Belarus
Crow
$53,043
MEDIAN EARNINGS
100.0/ 100
METRIC RATING
37th/ 347
METRIC RANK
$38,707
MEDIAN EARNINGS
0.0/ 100
METRIC RATING
336th/ 347
METRIC RANK
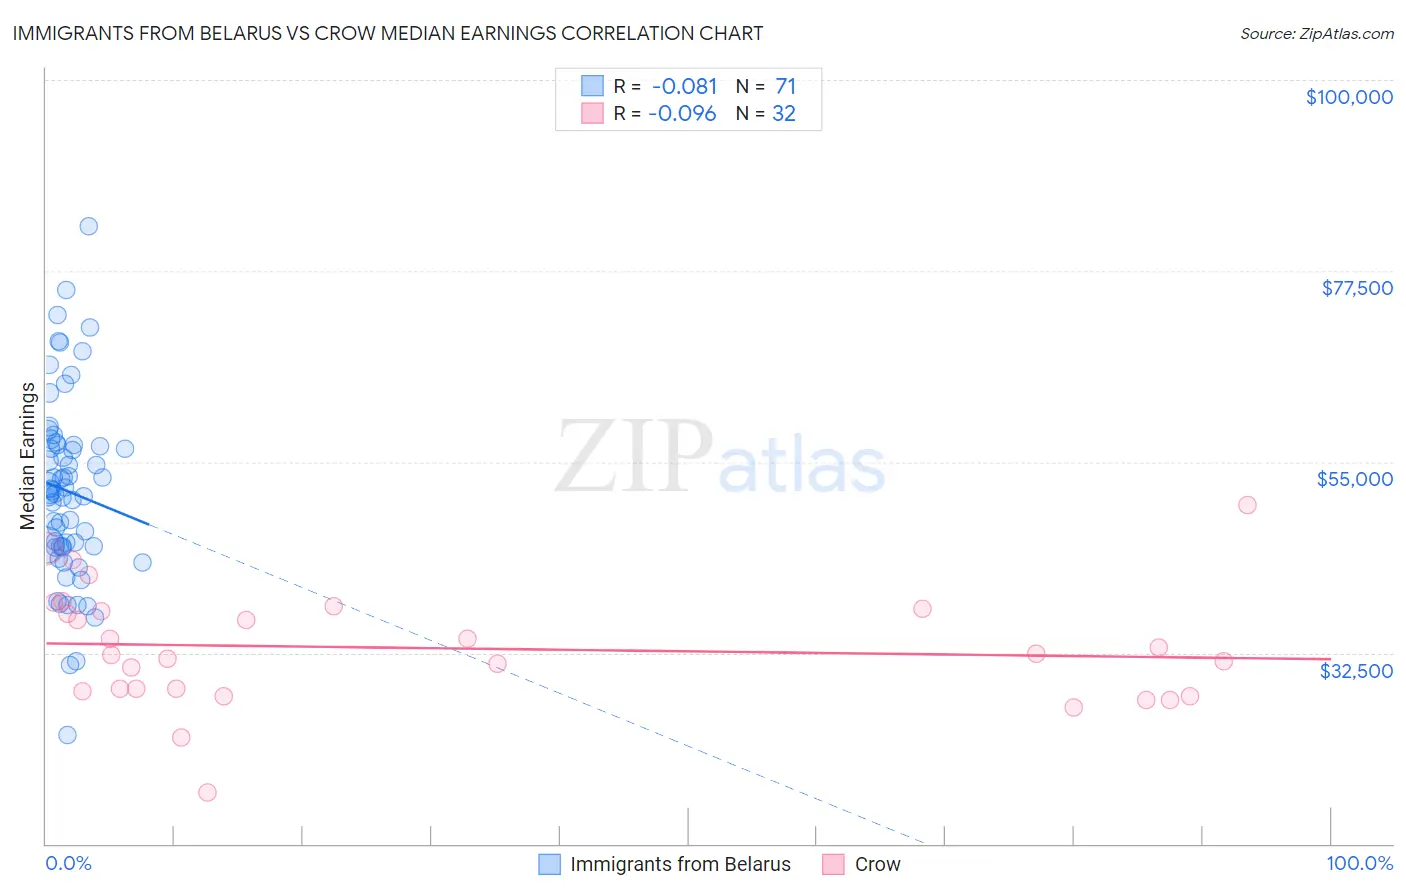
Immigrants from Belarus vs Crow Median Earnings Correlation Chart
The statistical analysis conducted on geographies consisting of 150,193,045 people shows a slight negative correlation between the proportion of Immigrants from Belarus and median earnings in the United States with a correlation coefficient (R) of -0.081 and weighted average of $53,043. Similarly, the statistical analysis conducted on geographies consisting of 59,204,148 people shows a slight negative correlation between the proportion of Crow and median earnings in the United States with a correlation coefficient (R) of -0.096 and weighted average of $38,707, a difference of 37.0%.
Median Earnings Correlation Summary
| Measurement | Immigrants from Belarus | Crow |
| Minimum | $22,866 | $16,094 |
| Maximum | $82,699 | $49,926 |
| Range | $59,833 | $33,832 |
| Mean | $51,554 | $33,045 |
| Median | $51,310 | $32,361 |
| Interquartile 25% (IQ1) | $45,000 | $28,093 |
| Interquartile 75% (IQ3) | $56,946 | $37,549 |
| Interquartile Range (IQR) | $11,946 | $9,456 |
| Standard Deviation (Sample) | $10,748 | $6,875 |
| Standard Deviation (Population) | $10,672 | $6,767 |
Similar Demographics by Median Earnings
Demographics Similar to Immigrants from Belarus by Median Earnings
In terms of median earnings, the demographic groups most similar to Immigrants from Belarus are Latvian ($53,001, a difference of 0.080%), Immigrants from Turkey ($52,960, a difference of 0.16%), Israeli ($52,937, a difference of 0.20%), Immigrants from Denmark ($53,186, a difference of 0.27%), and Immigrants from Switzerland ($53,211, a difference of 0.32%).
| Demographics | Rating | Rank | Median Earnings |
| Cambodians | 100.0 /100 | #30 | Exceptional $53,386 |
| Russians | 100.0 /100 | #31 | Exceptional $53,334 |
| Immigrants | Asia | 100.0 /100 | #32 | Exceptional $53,310 |
| Immigrants | Greece | 100.0 /100 | #33 | Exceptional $53,282 |
| Immigrants | Sri Lanka | 100.0 /100 | #34 | Exceptional $53,268 |
| Immigrants | Switzerland | 100.0 /100 | #35 | Exceptional $53,211 |
| Immigrants | Denmark | 100.0 /100 | #36 | Exceptional $53,186 |
| Immigrants | Belarus | 100.0 /100 | #37 | Exceptional $53,043 |
| Latvians | 100.0 /100 | #38 | Exceptional $53,001 |
| Immigrants | Turkey | 100.0 /100 | #39 | Exceptional $52,960 |
| Israelis | 100.0 /100 | #40 | Exceptional $52,937 |
| Immigrants | Lithuania | 100.0 /100 | #41 | Exceptional $52,769 |
| Maltese | 100.0 /100 | #42 | Exceptional $52,526 |
| Immigrants | Malaysia | 100.0 /100 | #43 | Exceptional $52,514 |
| Bulgarians | 100.0 /100 | #44 | Exceptional $52,512 |
Demographics Similar to Crow by Median Earnings
In terms of median earnings, the demographic groups most similar to Crow are Native/Alaskan ($38,896, a difference of 0.49%), Spanish American Indian ($38,907, a difference of 0.52%), Houma ($38,949, a difference of 0.62%), Immigrants from Cuba ($38,426, a difference of 0.73%), and Yakama ($39,107, a difference of 1.0%).
| Demographics | Rating | Rank | Median Earnings |
| Kiowa | 0.0 /100 | #329 | Tragic $39,232 |
| Immigrants | Congo | 0.0 /100 | #330 | Tragic $39,169 |
| Immigrants | Mexico | 0.0 /100 | #331 | Tragic $39,114 |
| Yakama | 0.0 /100 | #332 | Tragic $39,107 |
| Houma | 0.0 /100 | #333 | Tragic $38,949 |
| Spanish American Indians | 0.0 /100 | #334 | Tragic $38,907 |
| Natives/Alaskans | 0.0 /100 | #335 | Tragic $38,896 |
| Crow | 0.0 /100 | #336 | Tragic $38,707 |
| Immigrants | Cuba | 0.0 /100 | #337 | Tragic $38,426 |
| Pima | 0.0 /100 | #338 | Tragic $38,285 |
| Menominee | 0.0 /100 | #339 | Tragic $37,884 |
| Navajo | 0.0 /100 | #340 | Tragic $36,999 |
| Lumbee | 0.0 /100 | #341 | Tragic $36,876 |
| Hopi | 0.0 /100 | #342 | Tragic $36,871 |
| Pueblo | 0.0 /100 | #343 | Tragic $36,859 |