Immigrants from Cabo Verde vs Crow Unemployment Among Ages 65 to 74 years
COMPARE
Immigrants from Cabo Verde
Crow
Unemployment Among Ages 65 to 74 years
Unemployment Among Ages 65 to 74 years Comparison
Immigrants from Cabo Verde
Crow
5.3%
UNEMPLOYMENT AMONG AGES 65 TO 74 YEARS
72.5/ 100
METRIC RATING
153rd/ 347
METRIC RANK
17.4%
UNEMPLOYMENT AMONG AGES 65 TO 74 YEARS
0.0/ 100
METRIC RATING
347th/ 347
METRIC RANK
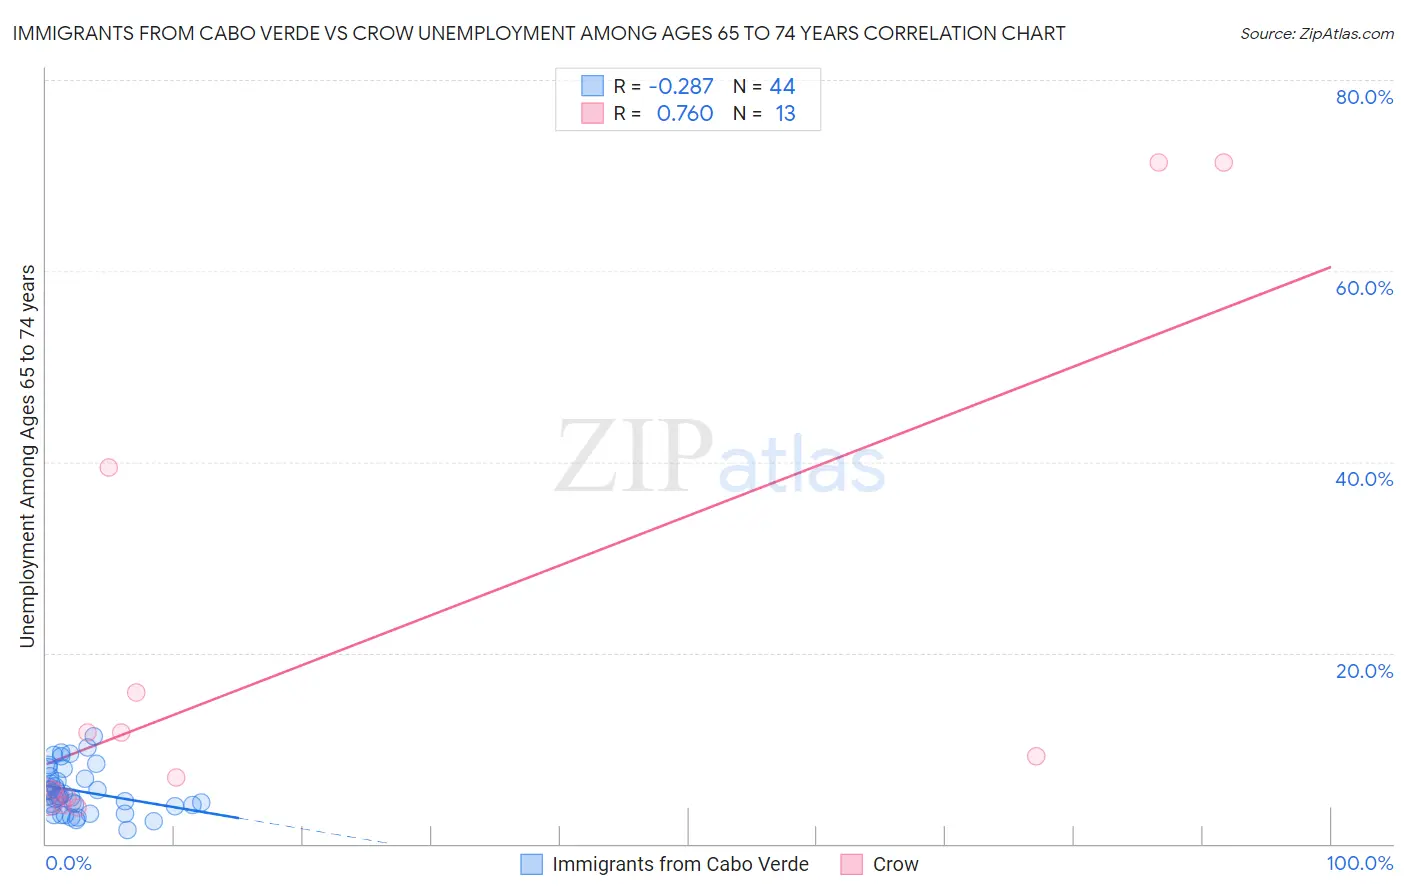
Immigrants from Cabo Verde vs Crow Unemployment Among Ages 65 to 74 years Correlation Chart
The statistical analysis conducted on geographies consisting of 36,895,301 people shows a weak negative correlation between the proportion of Immigrants from Cabo Verde and unemployment rate among population between the ages 65 and 74 in the United States with a correlation coefficient (R) of -0.287 and weighted average of 5.3%. Similarly, the statistical analysis conducted on geographies consisting of 55,742,978 people shows a strong positive correlation between the proportion of Crow and unemployment rate among population between the ages 65 and 74 in the United States with a correlation coefficient (R) of 0.760 and weighted average of 17.4%, a difference of 227.0%.
Unemployment Among Ages 65 to 74 years Correlation Summary
| Measurement | Immigrants from Cabo Verde | Crow |
| Minimum | 1.4% | 3.9% |
| Maximum | 11.3% | 71.4% |
| Range | 9.9% | 67.5% |
| Mean | 5.5% | 20.0% |
| Median | 5.0% | 9.1% |
| Interquartile 25% (IQ1) | 3.9% | 4.8% |
| Interquartile 75% (IQ3) | 6.9% | 27.6% |
| Interquartile Range (IQR) | 3.0% | 22.8% |
| Standard Deviation (Sample) | 2.4% | 24.6% |
| Standard Deviation (Population) | 2.4% | 23.7% |
Similar Demographics by Unemployment Among Ages 65 to 74 years
Demographics Similar to Immigrants from Cabo Verde by Unemployment Among Ages 65 to 74 years
In terms of unemployment among ages 65 to 74 years, the demographic groups most similar to Immigrants from Cabo Verde are Polish (5.3%, a difference of 0.0%), Spanish (5.3%, a difference of 0.010%), Immigrants from Indonesia (5.3%, a difference of 0.020%), Immigrants from Cameroon (5.3%, a difference of 0.020%), and Dutch (5.3%, a difference of 0.020%).
| Demographics | Rating | Rank | Unemployment Among Ages 65 to 74 years |
| Irish | 74.8 /100 | #146 | Good 5.3% |
| Immigrants | Latvia | 74.6 /100 | #147 | Good 5.3% |
| Immigrants | Sri Lanka | 73.8 /100 | #148 | Good 5.3% |
| Immigrants | Romania | 73.5 /100 | #149 | Good 5.3% |
| Immigrants | Poland | 73.2 /100 | #150 | Good 5.3% |
| Immigrants | Indonesia | 72.9 /100 | #151 | Good 5.3% |
| Spanish | 72.6 /100 | #152 | Good 5.3% |
| Immigrants | Cabo Verde | 72.5 /100 | #153 | Good 5.3% |
| Poles | 72.4 /100 | #154 | Good 5.3% |
| Immigrants | Cameroon | 72.1 /100 | #155 | Good 5.3% |
| Dutch | 72.0 /100 | #156 | Good 5.3% |
| Immigrants | Eastern Europe | 71.5 /100 | #157 | Good 5.3% |
| Immigrants | France | 71.0 /100 | #158 | Good 5.3% |
| Immigrants | Czechoslovakia | 66.3 /100 | #159 | Good 5.3% |
| Bangladeshis | 65.8 /100 | #160 | Good 5.3% |
Demographics Similar to Crow by Unemployment Among Ages 65 to 74 years
In terms of unemployment among ages 65 to 74 years, the demographic groups most similar to Crow are Yup'ik (9.5%, a difference of 84.0%), Immigrants from Yemen (8.3%, a difference of 110.8%), Inupiat (7.5%, a difference of 132.3%), Alaskan Athabascan (7.4%, a difference of 136.7%), and Navajo (6.9%, a difference of 151.3%).
| Demographics | Rating | Rank | Unemployment Among Ages 65 to 74 years |
| Paiute | 0.0 /100 | #333 | Tragic 6.3% |
| Taiwanese | 0.0 /100 | #334 | Tragic 6.3% |
| Puerto Ricans | 0.0 /100 | #335 | Tragic 6.4% |
| Immigrants | Armenia | 0.0 /100 | #336 | Tragic 6.5% |
| Ute | 0.0 /100 | #337 | Tragic 6.5% |
| Tlingit-Haida | 0.0 /100 | #338 | Tragic 6.5% |
| Yakama | 0.0 /100 | #339 | Tragic 6.6% |
| Pima | 0.0 /100 | #340 | Tragic 6.6% |
| Alaska Natives | 0.0 /100 | #341 | Tragic 6.8% |
| Navajo | 0.0 /100 | #342 | Tragic 6.9% |
| Alaskan Athabascans | 0.0 /100 | #343 | Tragic 7.4% |
| Inupiat | 0.0 /100 | #344 | Tragic 7.5% |
| Immigrants | Yemen | 0.0 /100 | #345 | Tragic 8.3% |
| Yup'ik | 0.0 /100 | #346 | Tragic 9.5% |
| Crow | 0.0 /100 | #347 | Tragic 17.4% |