Immigrants from Central America vs Taiwanese Median Male Earnings
COMPARE
Immigrants from Central America
Taiwanese
Median Male Earnings
Median Male Earnings Comparison
Immigrants from Central America
Taiwanese
$45,538
MEDIAN MALE EARNINGS
0.0/ 100
METRIC RATING
323rd/ 347
METRIC RANK
$55,556
MEDIAN MALE EARNINGS
73.9/ 100
METRIC RATING
154th/ 347
METRIC RANK
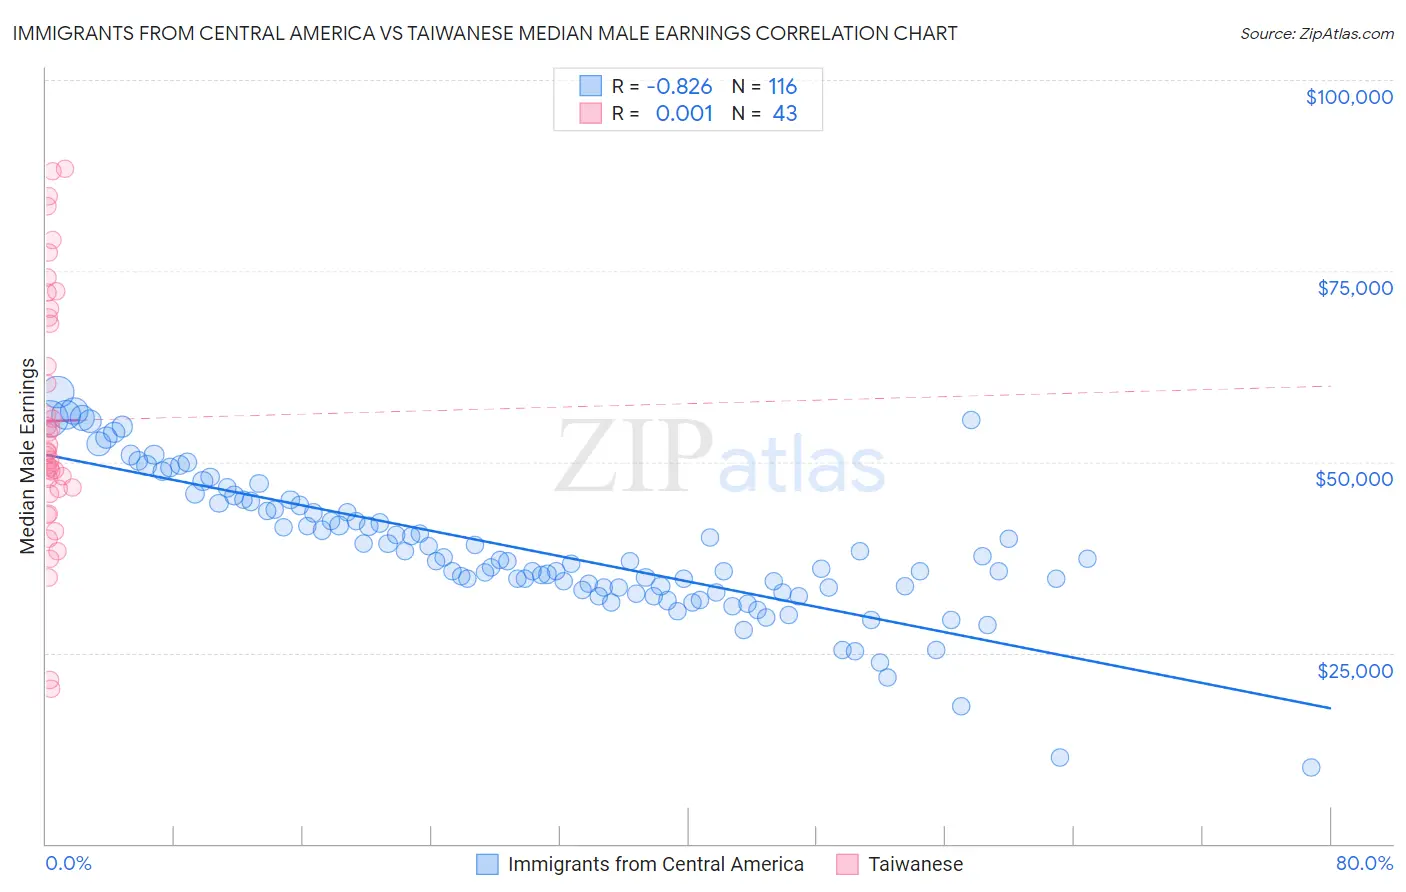
Immigrants from Central America vs Taiwanese Median Male Earnings Correlation Chart
The statistical analysis conducted on geographies consisting of 535,785,073 people shows a very strong negative correlation between the proportion of Immigrants from Central America and median male earnings in the United States with a correlation coefficient (R) of -0.826 and weighted average of $45,538. Similarly, the statistical analysis conducted on geographies consisting of 31,719,634 people shows no correlation between the proportion of Taiwanese and median male earnings in the United States with a correlation coefficient (R) of 0.001 and weighted average of $55,556, a difference of 22.0%.
Median Male Earnings Correlation Summary
| Measurement | Immigrants from Central America | Taiwanese |
| Minimum | $9,917 | $20,367 |
| Maximum | $59,113 | $88,333 |
| Range | $49,196 | $67,966 |
| Mean | $38,565 | $55,357 |
| Median | $37,031 | $51,283 |
| Interquartile 25% (IQ1) | $33,411 | $46,547 |
| Interquartile 75% (IQ3) | $44,421 | $68,930 |
| Interquartile Range (IQR) | $11,009 | $22,384 |
| Standard Deviation (Sample) | $9,104 | $16,341 |
| Standard Deviation (Population) | $9,065 | $16,149 |
Similar Demographics by Median Male Earnings
Demographics Similar to Immigrants from Central America by Median Male Earnings
In terms of median male earnings, the demographic groups most similar to Immigrants from Central America are Black/African American ($45,523, a difference of 0.030%), Sioux ($45,566, a difference of 0.060%), Fijian ($45,607, a difference of 0.15%), Yuman ($45,446, a difference of 0.20%), and Immigrants from Honduras ($45,787, a difference of 0.55%).
| Demographics | Rating | Rank | Median Male Earnings |
| Immigrants | Caribbean | 0.0 /100 | #316 | Tragic $46,193 |
| Mexicans | 0.0 /100 | #317 | Tragic $46,147 |
| Cheyenne | 0.0 /100 | #318 | Tragic $46,062 |
| Haitians | 0.0 /100 | #319 | Tragic $45,903 |
| Immigrants | Honduras | 0.0 /100 | #320 | Tragic $45,787 |
| Fijians | 0.0 /100 | #321 | Tragic $45,607 |
| Sioux | 0.0 /100 | #322 | Tragic $45,566 |
| Immigrants | Central America | 0.0 /100 | #323 | Tragic $45,538 |
| Blacks/African Americans | 0.0 /100 | #324 | Tragic $45,523 |
| Yuman | 0.0 /100 | #325 | Tragic $45,446 |
| Immigrants | Haiti | 0.0 /100 | #326 | Tragic $45,266 |
| Immigrants | Bahamas | 0.0 /100 | #327 | Tragic $45,176 |
| Kiowa | 0.0 /100 | #328 | Tragic $45,094 |
| Yakama | 0.0 /100 | #329 | Tragic $45,002 |
| Immigrants | Mexico | 0.0 /100 | #330 | Tragic $44,960 |
Demographics Similar to Taiwanese by Median Male Earnings
In terms of median male earnings, the demographic groups most similar to Taiwanese are Scandinavian ($55,527, a difference of 0.050%), Immigrants from Nepal ($55,615, a difference of 0.11%), Peruvian ($55,659, a difference of 0.19%), Immigrants from Ethiopia ($55,434, a difference of 0.22%), and Icelander ($55,415, a difference of 0.25%).
| Demographics | Rating | Rank | Median Male Earnings |
| Immigrants | Philippines | 78.4 /100 | #147 | Good $55,809 |
| Scottish | 78.2 /100 | #148 | Good $55,793 |
| English | 77.4 /100 | #149 | Good $55,747 |
| Swiss | 77.1 /100 | #150 | Good $55,731 |
| Immigrants | Oceania | 76.8 /100 | #151 | Good $55,712 |
| Peruvians | 75.8 /100 | #152 | Good $55,659 |
| Immigrants | Nepal | 75.0 /100 | #153 | Good $55,615 |
| Taiwanese | 73.9 /100 | #154 | Good $55,556 |
| Scandinavians | 73.4 /100 | #155 | Good $55,527 |
| Immigrants | Ethiopia | 71.6 /100 | #156 | Good $55,434 |
| Icelanders | 71.2 /100 | #157 | Good $55,415 |
| Czechoslovakians | 70.5 /100 | #158 | Good $55,382 |
| Alsatians | 70.5 /100 | #159 | Good $55,380 |
| Basques | 70.3 /100 | #160 | Good $55,370 |
| Belgians | 70.1 /100 | #161 | Good $55,361 |