U.S. Virgin Islander vs Taiwanese Median Male Earnings
COMPARE
U.S. Virgin Islander
Taiwanese
Median Male Earnings
Median Male Earnings Comparison
U.S. Virgin Islanders
Taiwanese
$47,066
MEDIAN MALE EARNINGS
0.1/ 100
METRIC RATING
300th/ 347
METRIC RANK
$55,556
MEDIAN MALE EARNINGS
73.9/ 100
METRIC RATING
154th/ 347
METRIC RANK
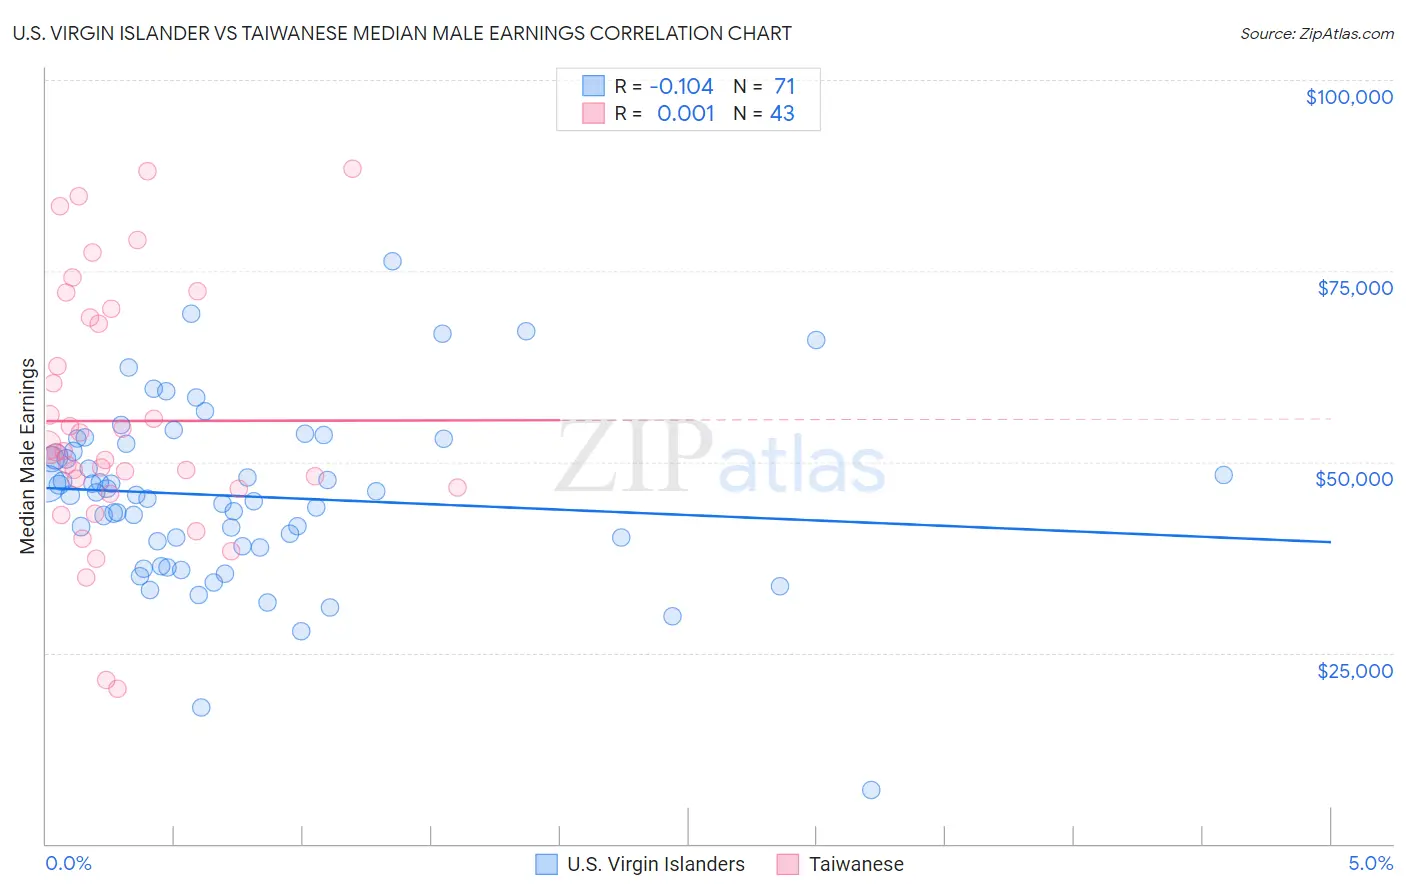
U.S. Virgin Islander vs Taiwanese Median Male Earnings Correlation Chart
The statistical analysis conducted on geographies consisting of 87,522,677 people shows a poor negative correlation between the proportion of U.S. Virgin Islanders and median male earnings in the United States with a correlation coefficient (R) of -0.104 and weighted average of $47,066. Similarly, the statistical analysis conducted on geographies consisting of 31,719,634 people shows no correlation between the proportion of Taiwanese and median male earnings in the United States with a correlation coefficient (R) of 0.001 and weighted average of $55,556, a difference of 18.0%.
Median Male Earnings Correlation Summary
| Measurement | U.S. Virgin Islander | Taiwanese |
| Minimum | $7,097 | $20,367 |
| Maximum | $76,348 | $88,333 |
| Range | $69,251 | $67,966 |
| Mean | $45,487 | $55,357 |
| Median | $45,658 | $51,283 |
| Interquartile 25% (IQ1) | $38,902 | $46,547 |
| Interquartile 75% (IQ3) | $52,442 | $68,930 |
| Interquartile Range (IQR) | $13,540 | $22,384 |
| Standard Deviation (Sample) | $11,420 | $16,341 |
| Standard Deviation (Population) | $11,340 | $16,149 |
Similar Demographics by Median Male Earnings
Demographics Similar to U.S. Virgin Islanders by Median Male Earnings
In terms of median male earnings, the demographic groups most similar to U.S. Virgin Islanders are Immigrants from Zaire ($47,070, a difference of 0.010%), Immigrants from Micronesia ($47,177, a difference of 0.23%), Immigrants from Latin America ($46,941, a difference of 0.27%), Dominican ($47,204, a difference of 0.29%), and Inupiat ($47,281, a difference of 0.46%).
| Demographics | Rating | Rank | Median Male Earnings |
| Indonesians | 0.1 /100 | #293 | Tragic $47,503 |
| Immigrants | Nicaragua | 0.1 /100 | #294 | Tragic $47,482 |
| Central American Indians | 0.1 /100 | #295 | Tragic $47,433 |
| Inupiat | 0.1 /100 | #296 | Tragic $47,281 |
| Dominicans | 0.1 /100 | #297 | Tragic $47,204 |
| Immigrants | Micronesia | 0.1 /100 | #298 | Tragic $47,177 |
| Immigrants | Zaire | 0.1 /100 | #299 | Tragic $47,070 |
| U.S. Virgin Islanders | 0.1 /100 | #300 | Tragic $47,066 |
| Immigrants | Latin America | 0.1 /100 | #301 | Tragic $46,941 |
| Seminole | 0.1 /100 | #302 | Tragic $46,783 |
| Yaqui | 0.1 /100 | #303 | Tragic $46,777 |
| Bangladeshis | 0.1 /100 | #304 | Tragic $46,744 |
| Guatemalans | 0.0 /100 | #305 | Tragic $46,736 |
| Dutch West Indians | 0.0 /100 | #306 | Tragic $46,656 |
| Immigrants | Dominican Republic | 0.0 /100 | #307 | Tragic $46,655 |
Demographics Similar to Taiwanese by Median Male Earnings
In terms of median male earnings, the demographic groups most similar to Taiwanese are Scandinavian ($55,527, a difference of 0.050%), Immigrants from Nepal ($55,615, a difference of 0.11%), Peruvian ($55,659, a difference of 0.19%), Immigrants from Ethiopia ($55,434, a difference of 0.22%), and Icelander ($55,415, a difference of 0.25%).
| Demographics | Rating | Rank | Median Male Earnings |
| Immigrants | Philippines | 78.4 /100 | #147 | Good $55,809 |
| Scottish | 78.2 /100 | #148 | Good $55,793 |
| English | 77.4 /100 | #149 | Good $55,747 |
| Swiss | 77.1 /100 | #150 | Good $55,731 |
| Immigrants | Oceania | 76.8 /100 | #151 | Good $55,712 |
| Peruvians | 75.8 /100 | #152 | Good $55,659 |
| Immigrants | Nepal | 75.0 /100 | #153 | Good $55,615 |
| Taiwanese | 73.9 /100 | #154 | Good $55,556 |
| Scandinavians | 73.4 /100 | #155 | Good $55,527 |
| Immigrants | Ethiopia | 71.6 /100 | #156 | Good $55,434 |
| Icelanders | 71.2 /100 | #157 | Good $55,415 |
| Czechoslovakians | 70.5 /100 | #158 | Good $55,382 |
| Alsatians | 70.5 /100 | #159 | Good $55,380 |
| Basques | 70.3 /100 | #160 | Good $55,370 |
| Belgians | 70.1 /100 | #161 | Good $55,361 |