Irish vs Immigrants from Uruguay Median Female Earnings
COMPARE
Irish
Immigrants from Uruguay
Median Female Earnings
Median Female Earnings Comparison
Irish
Immigrants from Uruguay
$39,291
MEDIAN FEMALE EARNINGS
30.0/ 100
METRIC RATING
194th/ 347
METRIC RANK
$38,945
MEDIAN FEMALE EARNINGS
17.3/ 100
METRIC RATING
204th/ 347
METRIC RANK
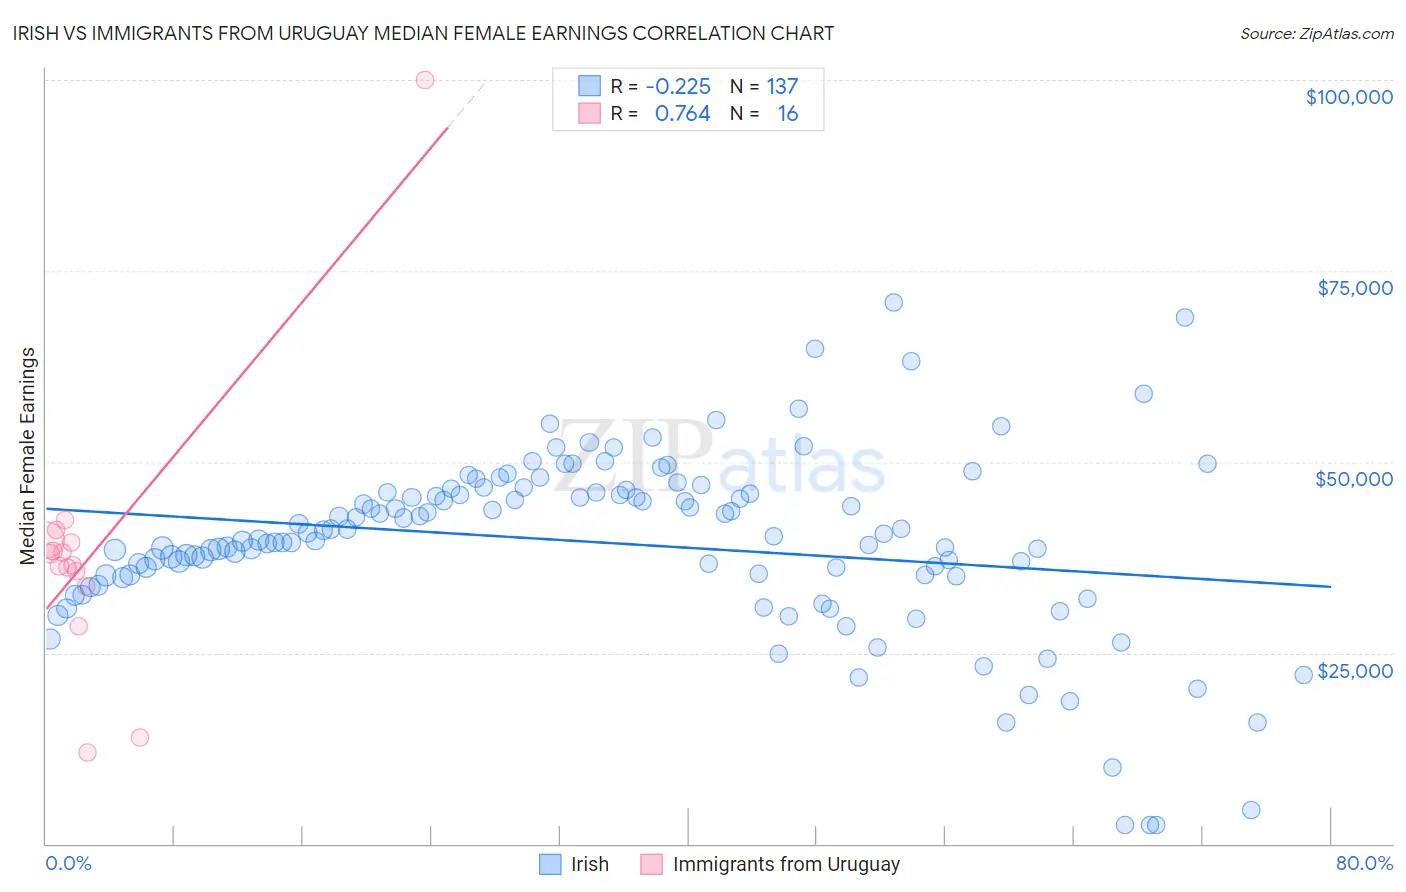
Irish vs Immigrants from Uruguay Median Female Earnings Correlation Chart
The statistical analysis conducted on geographies consisting of 577,855,613 people shows a weak negative correlation between the proportion of Irish and median female earnings in the United States with a correlation coefficient (R) of -0.225 and weighted average of $39,291. Similarly, the statistical analysis conducted on geographies consisting of 133,253,998 people shows a strong positive correlation between the proportion of Immigrants from Uruguay and median female earnings in the United States with a correlation coefficient (R) of 0.764 and weighted average of $38,945, a difference of 0.89%.
Median Female Earnings Correlation Summary
| Measurement | Irish | Immigrants from Uruguay |
| Minimum | $2,499 | $12,017 |
| Maximum | $70,827 | $100,000 |
| Range | $68,328 | $87,983 |
| Mean | $39,404 | $38,117 |
| Median | $40,229 | $37,217 |
| Interquartile 25% (IQ1) | $35,070 | $34,685 |
| Interquartile 75% (IQ3) | $45,938 | $39,605 |
| Interquartile Range (IQR) | $10,868 | $4,920 |
| Standard Deviation (Sample) | $11,843 | $18,714 |
| Standard Deviation (Population) | $11,799 | $18,119 |
Demographics Similar to Irish and Immigrants from Uruguay by Median Female Earnings
In terms of median female earnings, the demographic groups most similar to Irish are Immigrants from Nigeria ($39,294, a difference of 0.010%), Immigrants ($39,328, a difference of 0.090%), Immigrants from Western Africa ($39,351, a difference of 0.15%), Uruguayan ($39,228, a difference of 0.16%), and Puget Sound Salish ($39,376, a difference of 0.22%). Similarly, the demographic groups most similar to Immigrants from Uruguay are Immigrants from Colombia ($38,913, a difference of 0.080%), Czech ($38,992, a difference of 0.12%), Immigrants from Bosnia and Herzegovina ($38,886, a difference of 0.15%), Slovak ($39,029, a difference of 0.22%), and Immigrants from Panama ($39,049, a difference of 0.27%).
| Demographics | Rating | Rank | Median Female Earnings |
| Senegalese | 34.2 /100 | #189 | Fair $39,384 |
| Puget Sound Salish | 33.9 /100 | #190 | Fair $39,376 |
| Immigrants | Western Africa | 32.7 /100 | #191 | Fair $39,351 |
| Immigrants | Immigrants | 31.7 /100 | #192 | Fair $39,328 |
| Immigrants | Nigeria | 30.2 /100 | #193 | Fair $39,294 |
| Irish | 30.0 /100 | #194 | Fair $39,291 |
| Uruguayans | 27.3 /100 | #195 | Fair $39,228 |
| Immigrants | Costa Rica | 25.6 /100 | #196 | Fair $39,186 |
| Assyrians/Chaldeans/Syriacs | 24.6 /100 | #197 | Fair $39,159 |
| Ecuadorians | 23.0 /100 | #198 | Fair $39,117 |
| Icelanders | 22.7 /100 | #199 | Fair $39,109 |
| Immigrants | Panama | 20.6 /100 | #200 | Fair $39,049 |
| Panamanians | 20.6 /100 | #201 | Fair $39,049 |
| Slovaks | 19.9 /100 | #202 | Poor $39,029 |
| Czechs | 18.7 /100 | #203 | Poor $38,992 |
| Immigrants | Uruguay | 17.3 /100 | #204 | Poor $38,945 |
| Immigrants | Colombia | 16.3 /100 | #205 | Poor $38,913 |
| Immigrants | Bosnia and Herzegovina | 15.6 /100 | #206 | Poor $38,886 |
| Immigrants | Cambodia | 14.2 /100 | #207 | Poor $38,833 |
| Immigrants | Thailand | 13.6 /100 | #208 | Poor $38,810 |
| Norwegians | 13.4 /100 | #209 | Poor $38,802 |