Immigrants from Bulgaria vs Belgian Median Earnings
COMPARE
Immigrants from Bulgaria
Belgian
Median Earnings
Median Earnings Comparison
Immigrants from Bulgaria
Belgians
$51,318
MEDIAN EARNINGS
99.9/ 100
METRIC RATING
63rd/ 347
METRIC RANK
$46,375
MEDIAN EARNINGS
48.0/ 100
METRIC RATING
177th/ 347
METRIC RANK
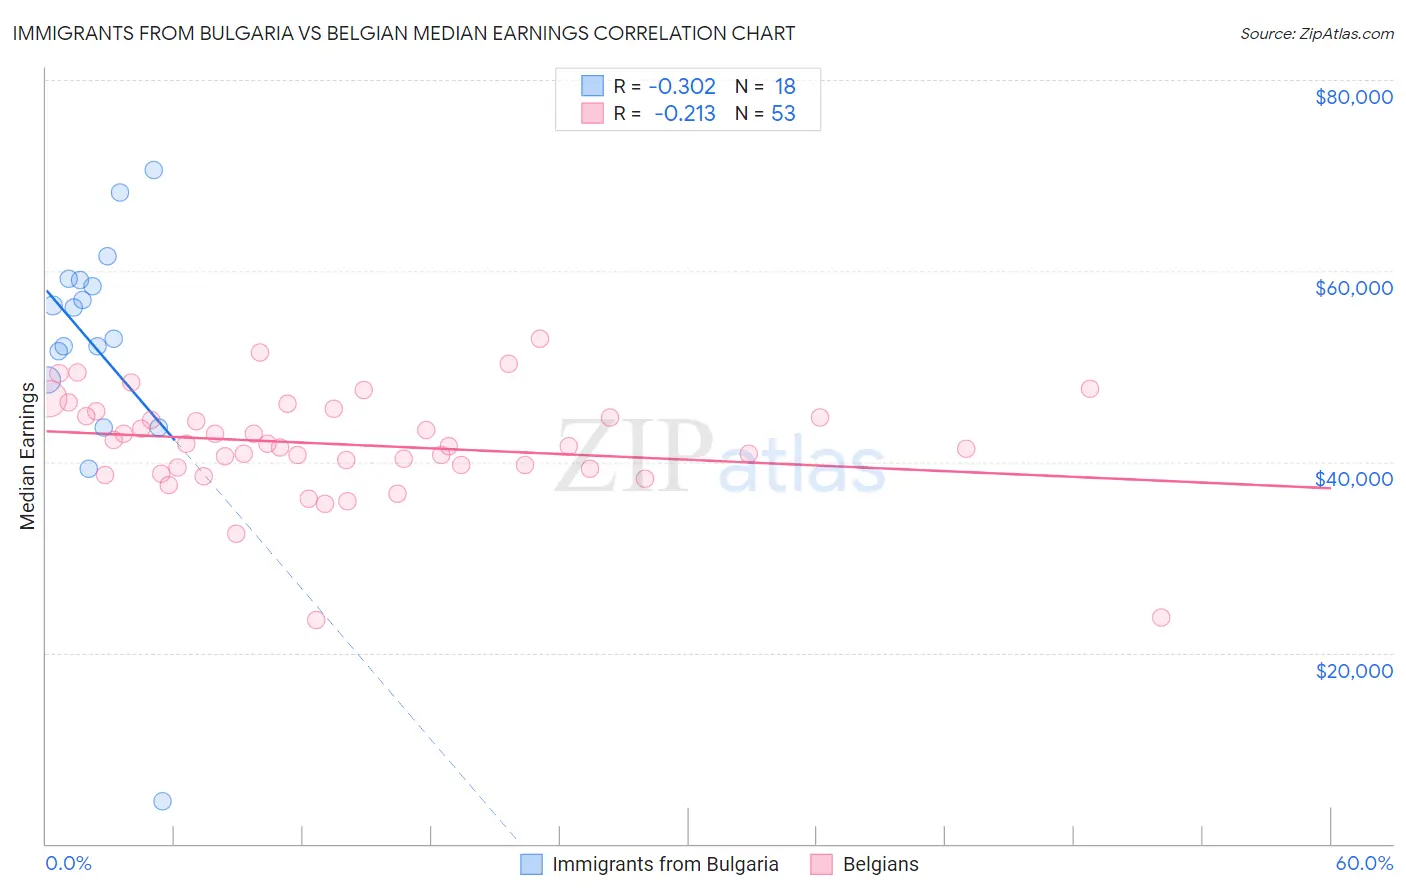
Immigrants from Bulgaria vs Belgian Median Earnings Correlation Chart
The statistical analysis conducted on geographies consisting of 172,536,651 people shows a mild negative correlation between the proportion of Immigrants from Bulgaria and median earnings in the United States with a correlation coefficient (R) of -0.302 and weighted average of $51,318. Similarly, the statistical analysis conducted on geographies consisting of 356,004,504 people shows a weak negative correlation between the proportion of Belgians and median earnings in the United States with a correlation coefficient (R) of -0.213 and weighted average of $46,375, a difference of 10.7%.
Median Earnings Correlation Summary
| Measurement | Immigrants from Bulgaria | Belgian |
| Minimum | $4,447 | $23,500 |
| Maximum | $70,600 | $52,848 |
| Range | $66,153 | $29,348 |
| Mean | $51,928 | $41,793 |
| Median | $54,557 | $41,635 |
| Interquartile 25% (IQ1) | $48,616 | $39,329 |
| Interquartile 75% (IQ3) | $58,987 | $45,075 |
| Interquartile Range (IQR) | $10,371 | $5,747 |
| Standard Deviation (Sample) | $14,304 | $5,579 |
| Standard Deviation (Population) | $13,901 | $5,526 |
Similar Demographics by Median Earnings
Demographics Similar to Immigrants from Bulgaria by Median Earnings
In terms of median earnings, the demographic groups most similar to Immigrants from Bulgaria are Immigrants from Romania ($51,337, a difference of 0.040%), New Zealander ($51,246, a difference of 0.14%), Greek ($51,164, a difference of 0.30%), Afghan ($51,112, a difference of 0.40%), and Immigrants from Spain ($51,092, a difference of 0.44%).
| Demographics | Rating | Rank | Median Earnings |
| Immigrants | Pakistan | 99.9 /100 | #56 | Exceptional $51,693 |
| Immigrants | Eastern Europe | 99.9 /100 | #57 | Exceptional $51,624 |
| Immigrants | Bolivia | 99.9 /100 | #58 | Exceptional $51,605 |
| Immigrants | Croatia | 99.9 /100 | #59 | Exceptional $51,581 |
| Immigrants | Serbia | 99.9 /100 | #60 | Exceptional $51,557 |
| Immigrants | Latvia | 99.9 /100 | #61 | Exceptional $51,555 |
| Immigrants | Romania | 99.9 /100 | #62 | Exceptional $51,337 |
| Immigrants | Bulgaria | 99.9 /100 | #63 | Exceptional $51,318 |
| New Zealanders | 99.9 /100 | #64 | Exceptional $51,246 |
| Greeks | 99.9 /100 | #65 | Exceptional $51,164 |
| Afghans | 99.9 /100 | #66 | Exceptional $51,112 |
| Immigrants | Spain | 99.9 /100 | #67 | Exceptional $51,092 |
| Paraguayans | 99.9 /100 | #68 | Exceptional $51,068 |
| Mongolians | 99.8 /100 | #69 | Exceptional $51,038 |
| Lithuanians | 99.8 /100 | #70 | Exceptional $50,991 |
Demographics Similar to Belgians by Median Earnings
In terms of median earnings, the demographic groups most similar to Belgians are Danish ($46,392, a difference of 0.040%), Basque ($46,399, a difference of 0.050%), Colombian ($46,349, a difference of 0.060%), English ($46,334, a difference of 0.090%), and Puget Sound Salish ($46,333, a difference of 0.090%).
| Demographics | Rating | Rank | Median Earnings |
| Immigrants | Immigrants | 51.6 /100 | #170 | Average $46,478 |
| Scottish | 51.1 /100 | #171 | Average $46,463 |
| Kenyans | 51.0 /100 | #172 | Average $46,462 |
| Ghanaians | 50.3 /100 | #173 | Average $46,440 |
| Scandinavians | 50.0 /100 | #174 | Average $46,433 |
| Basques | 48.8 /100 | #175 | Average $46,399 |
| Danes | 48.6 /100 | #176 | Average $46,392 |
| Belgians | 48.0 /100 | #177 | Average $46,375 |
| Colombians | 47.1 /100 | #178 | Average $46,349 |
| English | 46.5 /100 | #179 | Average $46,334 |
| Puget Sound Salish | 46.5 /100 | #180 | Average $46,333 |
| Immigrants | Cameroon | 46.4 /100 | #181 | Average $46,329 |
| Swiss | 45.9 /100 | #182 | Average $46,315 |
| French | 45.2 /100 | #183 | Average $46,296 |
| Immigrants | Kenya | 42.4 /100 | #184 | Average $46,214 |