Immigrants from Bulgaria vs Tsimshian Male Unemployment
COMPARE
Immigrants from Bulgaria
Tsimshian
Male Unemployment
Male Unemployment Comparison
Immigrants from Bulgaria
Tsimshian
5.0%
MALE UNEMPLOYMENT
98.7/ 100
METRIC RATING
56th/ 347
METRIC RANK
8.5%
MALE UNEMPLOYMENT
0.0/ 100
METRIC RATING
334th/ 347
METRIC RANK
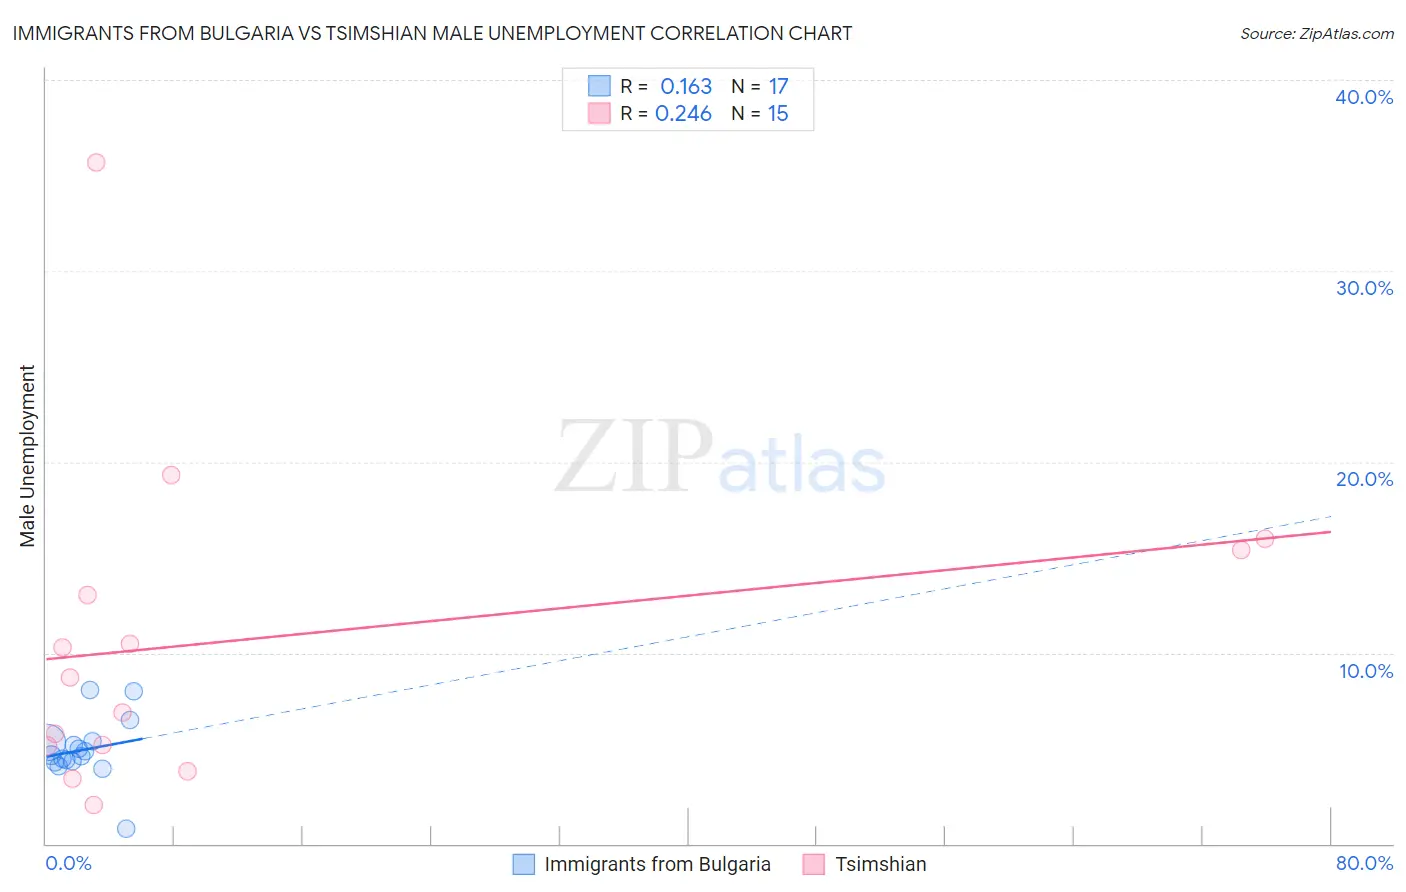
Immigrants from Bulgaria vs Tsimshian Male Unemployment Correlation Chart
The statistical analysis conducted on geographies consisting of 172,373,504 people shows a poor positive correlation between the proportion of Immigrants from Bulgaria and unemployment rate among males in the United States with a correlation coefficient (R) of 0.163 and weighted average of 5.0%. Similarly, the statistical analysis conducted on geographies consisting of 15,613,259 people shows a weak positive correlation between the proportion of Tsimshian and unemployment rate among males in the United States with a correlation coefficient (R) of 0.246 and weighted average of 8.5%, a difference of 70.6%.
Male Unemployment Correlation Summary
| Measurement | Immigrants from Bulgaria | Tsimshian |
| Minimum | 0.80% | 2.0% |
| Maximum | 8.0% | 35.7% |
| Range | 7.2% | 33.7% |
| Mean | 4.9% | 10.7% |
| Median | 4.6% | 8.7% |
| Interquartile 25% (IQ1) | 4.3% | 5.1% |
| Interquartile 75% (IQ3) | 5.3% | 15.4% |
| Interquartile Range (IQR) | 1.0% | 10.3% |
| Standard Deviation (Sample) | 1.6% | 8.6% |
| Standard Deviation (Population) | 1.6% | 8.3% |
Similar Demographics by Male Unemployment
Demographics Similar to Immigrants from Bulgaria by Male Unemployment
In terms of male unemployment, the demographic groups most similar to Immigrants from Bulgaria are Czechoslovakian (5.0%, a difference of 0.0%), Yugoslavian (5.0%, a difference of 0.010%), Jordanian (5.0%, a difference of 0.11%), Irish (5.0%, a difference of 0.17%), and Slovene (5.0%, a difference of 0.19%).
| Demographics | Rating | Rank | Male Unemployment |
| Poles | 98.9 /100 | #49 | Exceptional 4.9% |
| Croatians | 98.9 /100 | #50 | Exceptional 4.9% |
| Slovenes | 98.8 /100 | #51 | Exceptional 5.0% |
| Irish | 98.8 /100 | #52 | Exceptional 5.0% |
| Jordanians | 98.8 /100 | #53 | Exceptional 5.0% |
| Yugoslavians | 98.7 /100 | #54 | Exceptional 5.0% |
| Czechoslovakians | 98.7 /100 | #55 | Exceptional 5.0% |
| Immigrants | Bulgaria | 98.7 /100 | #56 | Exceptional 5.0% |
| Turks | 98.5 /100 | #57 | Exceptional 5.0% |
| Lithuanians | 98.5 /100 | #58 | Exceptional 5.0% |
| Immigrants | Netherlands | 98.3 /100 | #59 | Exceptional 5.0% |
| Immigrants | Argentina | 98.1 /100 | #60 | Exceptional 5.0% |
| Cambodians | 98.1 /100 | #61 | Exceptional 5.0% |
| Basques | 97.9 /100 | #62 | Exceptional 5.0% |
| Eastern Europeans | 97.9 /100 | #63 | Exceptional 5.0% |
Demographics Similar to Tsimshian by Male Unemployment
In terms of male unemployment, the demographic groups most similar to Tsimshian are Pueblo (8.5%, a difference of 0.060%), Sioux (8.4%, a difference of 0.97%), Yuman (8.6%, a difference of 1.4%), Puerto Rican (8.6%, a difference of 1.5%), and Apache (8.6%, a difference of 1.7%).
| Demographics | Rating | Rank | Male Unemployment |
| Paiute | 0.0 /100 | #327 | Tragic 7.7% |
| Natives/Alaskans | 0.0 /100 | #328 | Tragic 7.7% |
| Immigrants | Yemen | 0.0 /100 | #329 | Tragic 7.8% |
| Yakama | 0.0 /100 | #330 | Tragic 7.9% |
| Alaska Natives | 0.0 /100 | #331 | Tragic 8.1% |
| Pima | 0.0 /100 | #332 | Tragic 8.3% |
| Sioux | 0.0 /100 | #333 | Tragic 8.4% |
| Tsimshian | 0.0 /100 | #334 | Tragic 8.5% |
| Pueblo | 0.0 /100 | #335 | Tragic 8.5% |
| Yuman | 0.0 /100 | #336 | Tragic 8.6% |
| Puerto Ricans | 0.0 /100 | #337 | Tragic 8.6% |
| Apache | 0.0 /100 | #338 | Tragic 8.6% |
| Cheyenne | 0.0 /100 | #339 | Tragic 9.8% |
| Alaskan Athabascans | 0.0 /100 | #340 | Tragic 9.8% |
| Navajo | 0.0 /100 | #341 | Tragic 9.8% |