Immigrants from Bulgaria vs Tsimshian Professional Degree
COMPARE
Immigrants from Bulgaria
Tsimshian
Professional Degree
Professional Degree Comparison
Immigrants from Bulgaria
Tsimshian
5.5%
PROFESSIONAL DEGREE
99.9/ 100
METRIC RATING
67th/ 347
METRIC RANK
3.2%
PROFESSIONAL DEGREE
0.0/ 100
METRIC RATING
321st/ 347
METRIC RANK
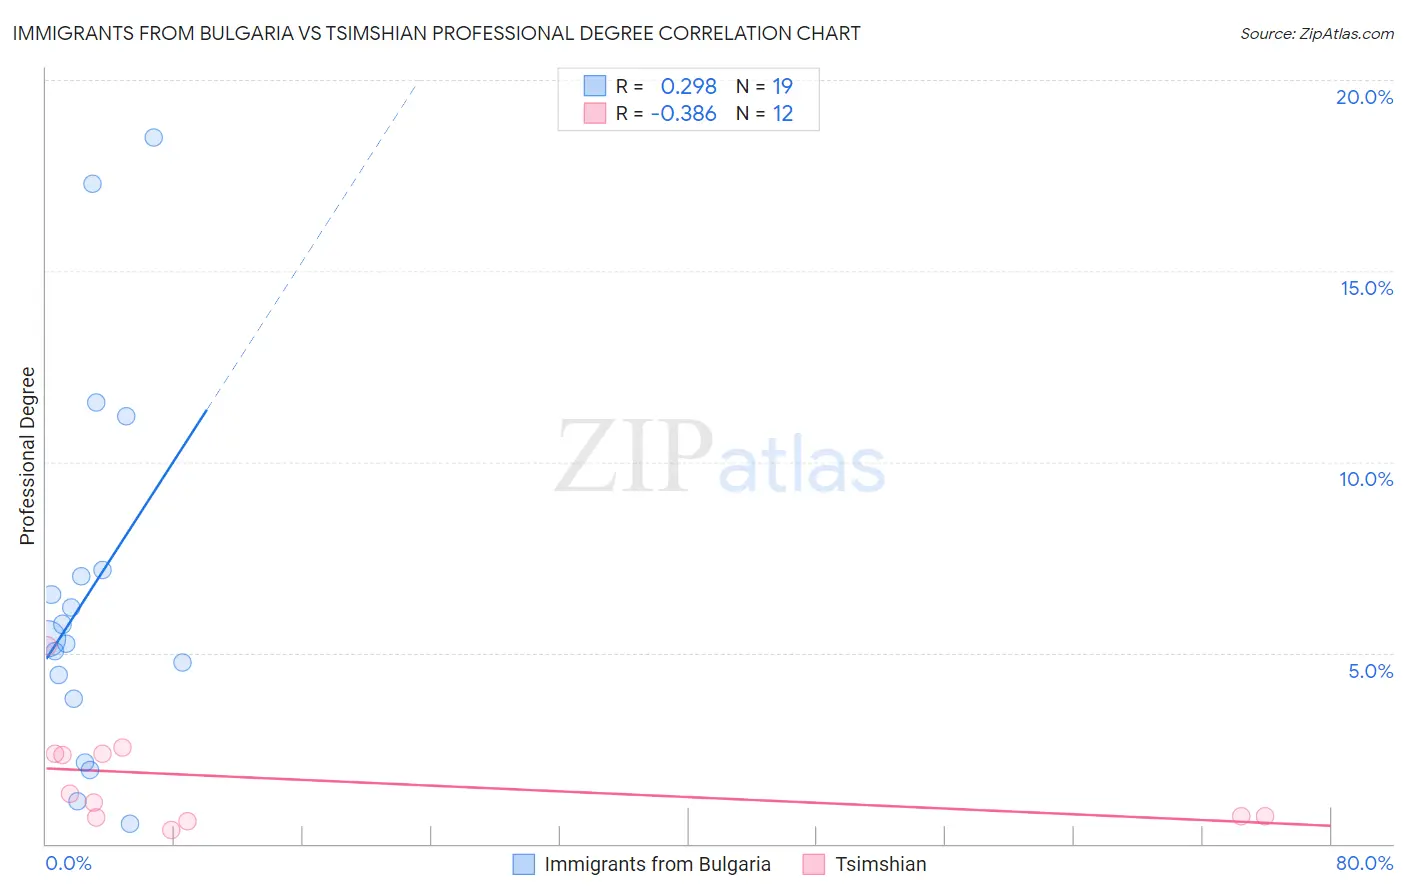
Immigrants from Bulgaria vs Tsimshian Professional Degree Correlation Chart
The statistical analysis conducted on geographies consisting of 172,510,370 people shows a weak positive correlation between the proportion of Immigrants from Bulgaria and percentage of population with at least professional degree education in the United States with a correlation coefficient (R) of 0.298 and weighted average of 5.5%. Similarly, the statistical analysis conducted on geographies consisting of 15,614,727 people shows a mild negative correlation between the proportion of Tsimshian and percentage of population with at least professional degree education in the United States with a correlation coefficient (R) of -0.386 and weighted average of 3.2%, a difference of 72.0%.
Professional Degree Correlation Summary
| Measurement | Immigrants from Bulgaria | Tsimshian |
| Minimum | 0.51% | 0.38% |
| Maximum | 18.5% | 5.2% |
| Range | 18.0% | 4.8% |
| Mean | 6.6% | 1.7% |
| Median | 5.4% | 1.2% |
| Interquartile 25% (IQ1) | 3.8% | 0.71% |
| Interquartile 75% (IQ3) | 7.2% | 2.4% |
| Interquartile Range (IQR) | 3.4% | 1.6% |
| Standard Deviation (Sample) | 4.9% | 1.4% |
| Standard Deviation (Population) | 4.8% | 1.3% |
Similar Demographics by Professional Degree
Demographics Similar to Immigrants from Bulgaria by Professional Degree
In terms of professional degree, the demographic groups most similar to Immigrants from Bulgaria are Immigrants from Lebanon (5.5%, a difference of 0.18%), Immigrants from Hungary (5.5%, a difference of 0.26%), Immigrants from Kazakhstan (5.5%, a difference of 0.32%), Immigrants from Bolivia (5.5%, a difference of 0.56%), and Bhutanese (5.4%, a difference of 0.59%).
| Demographics | Rating | Rank | Professional Degree |
| Bolivians | 99.9 /100 | #60 | Exceptional 5.6% |
| Immigrants | Lithuania | 99.9 /100 | #61 | Exceptional 5.6% |
| Immigrants | Belarus | 99.9 /100 | #62 | Exceptional 5.5% |
| Asians | 99.9 /100 | #63 | Exceptional 5.5% |
| Immigrants | Asia | 99.9 /100 | #64 | Exceptional 5.5% |
| Immigrants | Bolivia | 99.9 /100 | #65 | Exceptional 5.5% |
| Immigrants | Kazakhstan | 99.9 /100 | #66 | Exceptional 5.5% |
| Immigrants | Bulgaria | 99.9 /100 | #67 | Exceptional 5.5% |
| Immigrants | Lebanon | 99.9 /100 | #68 | Exceptional 5.5% |
| Immigrants | Hungary | 99.9 /100 | #69 | Exceptional 5.5% |
| Bhutanese | 99.8 /100 | #70 | Exceptional 5.4% |
| Immigrants | Western Asia | 99.8 /100 | #71 | Exceptional 5.4% |
| Lithuanians | 99.8 /100 | #72 | Exceptional 5.4% |
| Immigrants | Romania | 99.8 /100 | #73 | Exceptional 5.4% |
| Ethiopians | 99.7 /100 | #74 | Exceptional 5.4% |
Demographics Similar to Tsimshian by Professional Degree
In terms of professional degree, the demographic groups most similar to Tsimshian are Seminole (3.2%, a difference of 0.36%), Hispanic or Latino (3.2%, a difference of 0.36%), Inupiat (3.2%, a difference of 0.44%), Crow (3.2%, a difference of 0.72%), and Yaqui (3.2%, a difference of 0.78%).
| Demographics | Rating | Rank | Professional Degree |
| Mexican American Indians | 0.1 /100 | #314 | Tragic 3.3% |
| Immigrants | Laos | 0.1 /100 | #315 | Tragic 3.2% |
| Puerto Ricans | 0.1 /100 | #316 | Tragic 3.2% |
| Nepalese | 0.1 /100 | #317 | Tragic 3.2% |
| Immigrants | Micronesia | 0.1 /100 | #318 | Tragic 3.2% |
| Choctaw | 0.1 /100 | #319 | Tragic 3.2% |
| Seminole | 0.1 /100 | #320 | Tragic 3.2% |
| Tsimshian | 0.0 /100 | #321 | Tragic 3.2% |
| Hispanics or Latinos | 0.0 /100 | #322 | Tragic 3.2% |
| Inupiat | 0.0 /100 | #323 | Tragic 3.2% |
| Crow | 0.0 /100 | #324 | Tragic 3.2% |
| Yaqui | 0.0 /100 | #325 | Tragic 3.2% |
| Menominee | 0.0 /100 | #326 | Tragic 3.1% |
| Dutch West Indians | 0.0 /100 | #327 | Tragic 3.1% |
| Creek | 0.0 /100 | #328 | Tragic 3.1% |